The Optimization Page
The Optimization page provides an overview of the optimizations Warehouse Optimization performs on each warehouse over time. It enables tracking each optimization and comparing it with warehouse activity metrics such as query count, execution time, and queue time.
What Metrics Are Available at the Warehouse Level?
The page displays metrics and charts showing optimizations performed over time alongside each warehouse's query metrics. Filters customize the view by date range, account, label, and warehouse. The page displays data for one warehouse at a time.
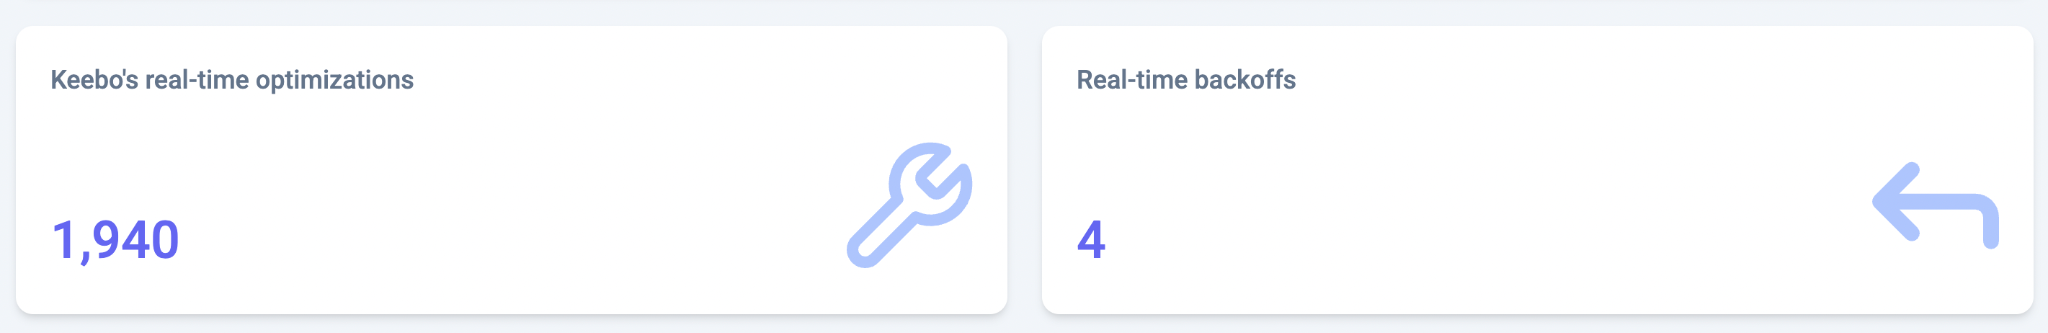
Real-Time Optimizations
This metric shows the total number of optimization decisions over the specified time range. Warehouse Optimization periodically evaluates each warehouse and decides whether to perform an optimization. The total includes both action and no-action decisions.
Real-Time Backoffs
This metric shows the total number of backoffs performed. A backoff reverses a previous optimization when a warehouse's performance meets specific criteria, such as higher-than-normal query latency. Backoff criteria are configured through performance guardrails on the Settings page.
Memory Optimizations Chart
Displays the memory optimizations performed over time. Memory optimizations adjust the auto-suspend time of the warehouse.
Resizing Optimizations Chart
Displays the warehouse resizing optimizations performed over time. Resizing optimizations adjust the size of the warehouse.
Multi-Cluster Optimizations Chart
Displays the multi-cluster optimizations performed over time. Multi-cluster optimizations adjust the maximum cluster count of the warehouse. Activity only appears in this chart for Snowflake Enterprise accounts.
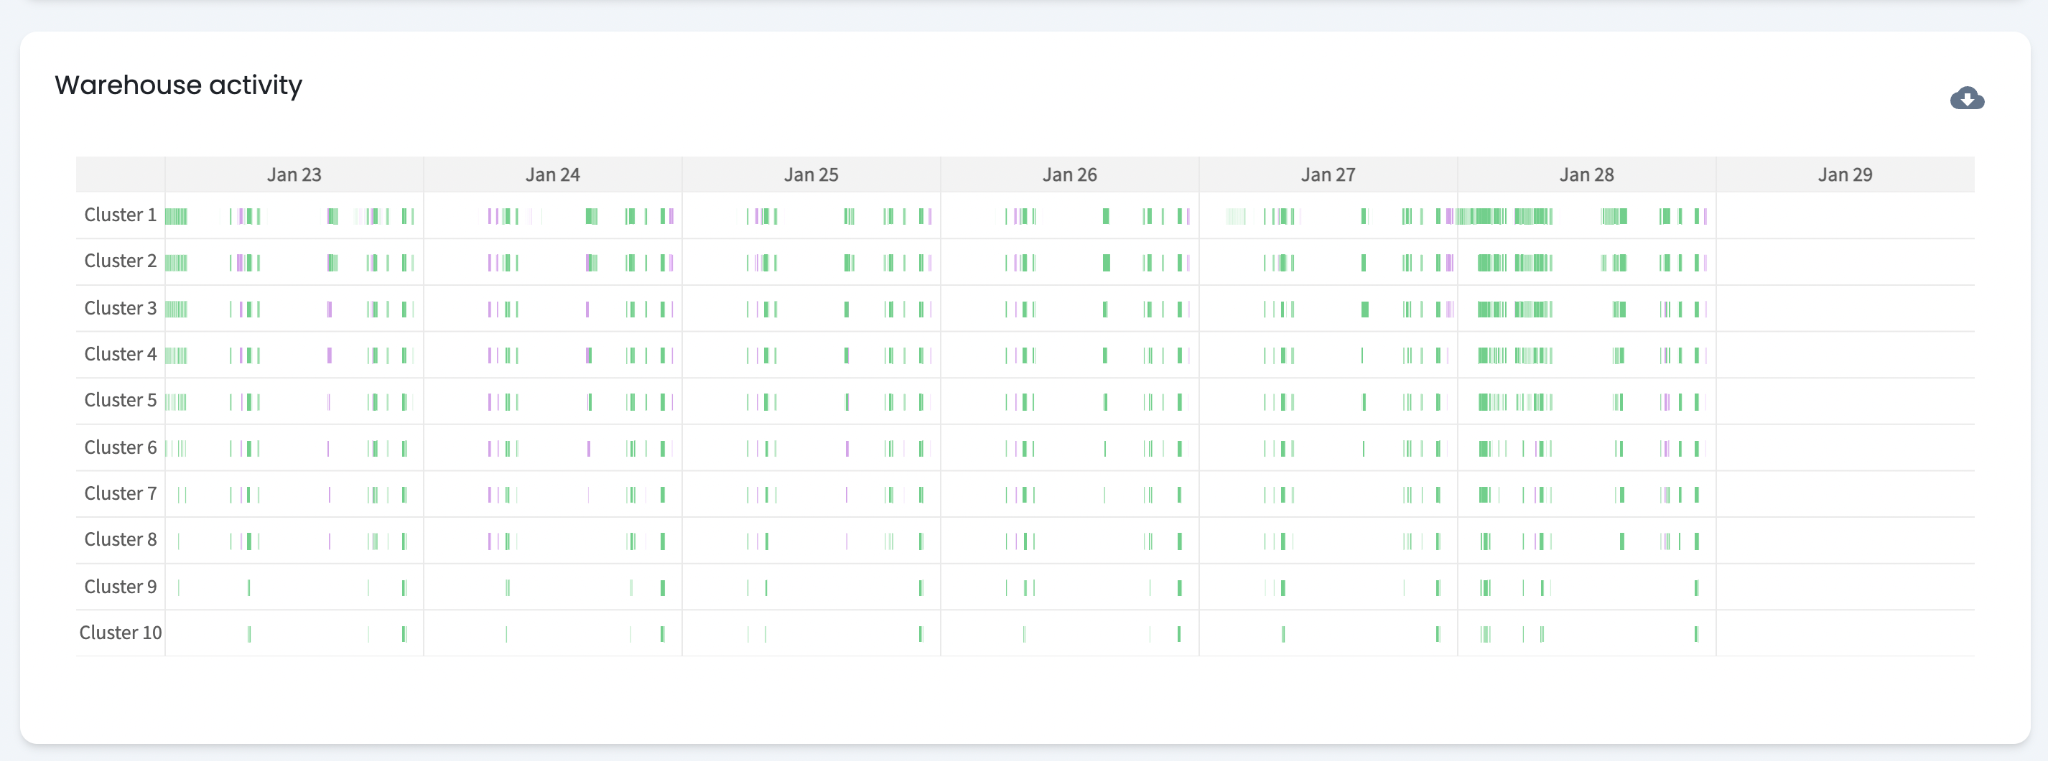
Warehouse Activity Chart
Highlights the times when a warehouse incurs costs. A cost block appears when the warehouse is running. For multi-cluster warehouses, a cost block appears for each active cluster.
How To Review Optimization Actions?
How Do Resizing Optimizations Work?
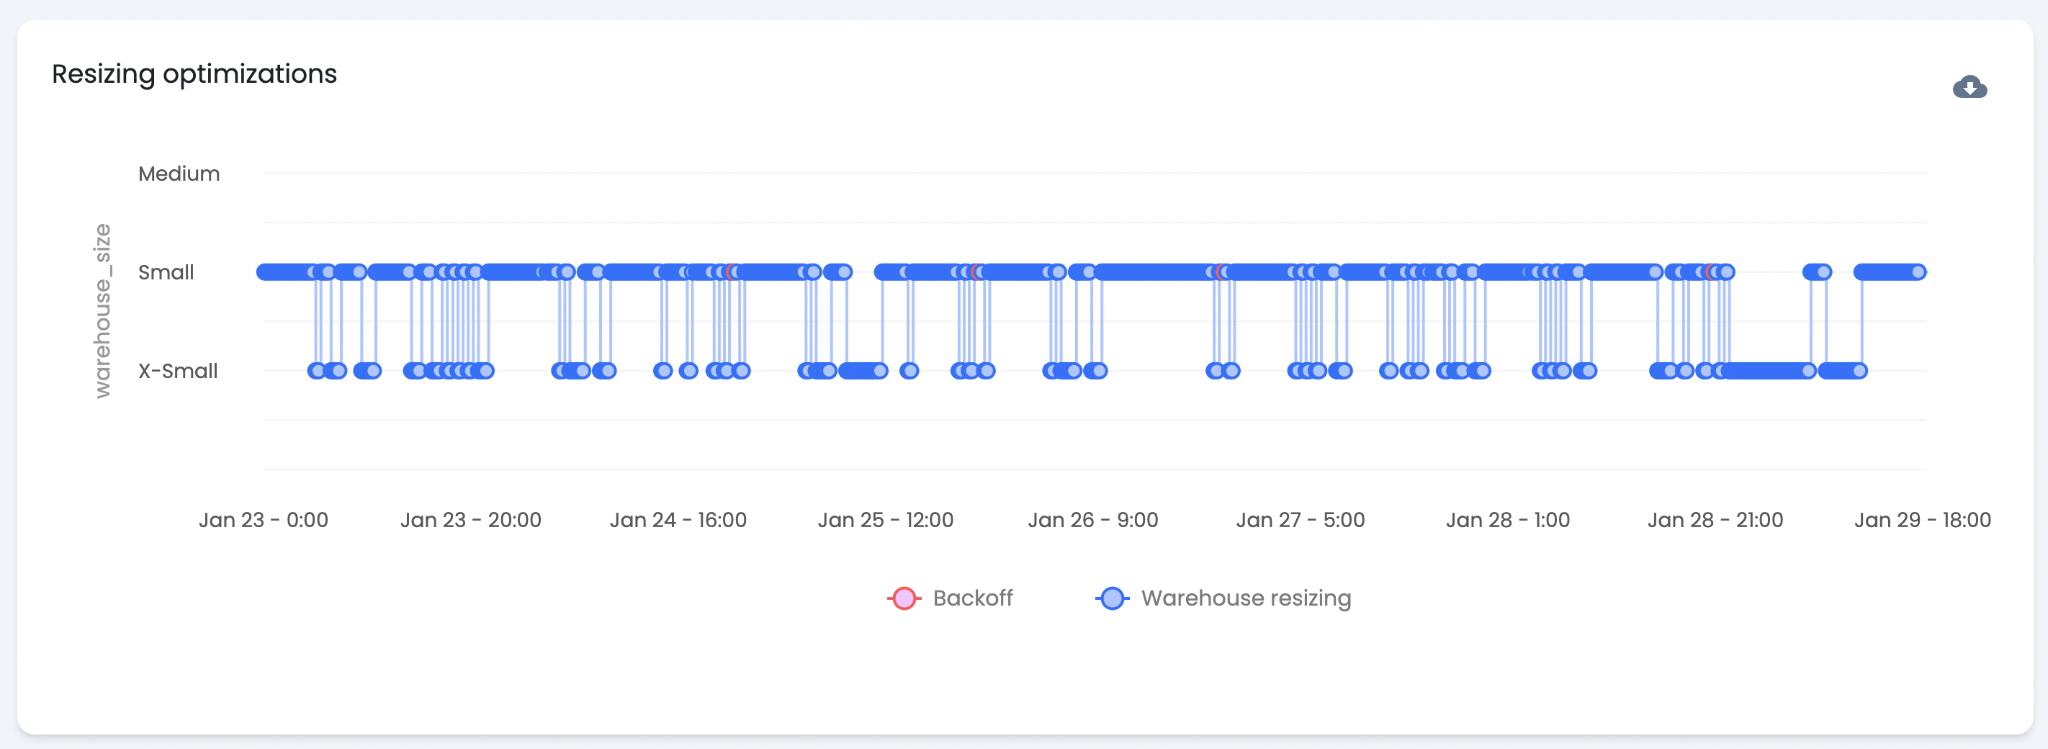
The "Resizing Optimization" chart shows when Warehouse Optimization resizes a warehouse and what size it sets. Resizing decisions are based on current and past workloads. Each blue dot represents a decision. Downsizes typically occur during periods of low query volume. A red dot indicates a backoff — Warehouse Optimization determined that a decision negatively affected performance.
Backoff Behavior
Performance guardrails on the Settings page govern resizing backoffs. A criteria and threshold determine when a backoff triggers. A default threshold is set based on the aggressiveness slider position. The current threshold and criteria are viewable from the Settings page by clicking "..." on the warehouse row.
How Do Memory Optimizations Work?
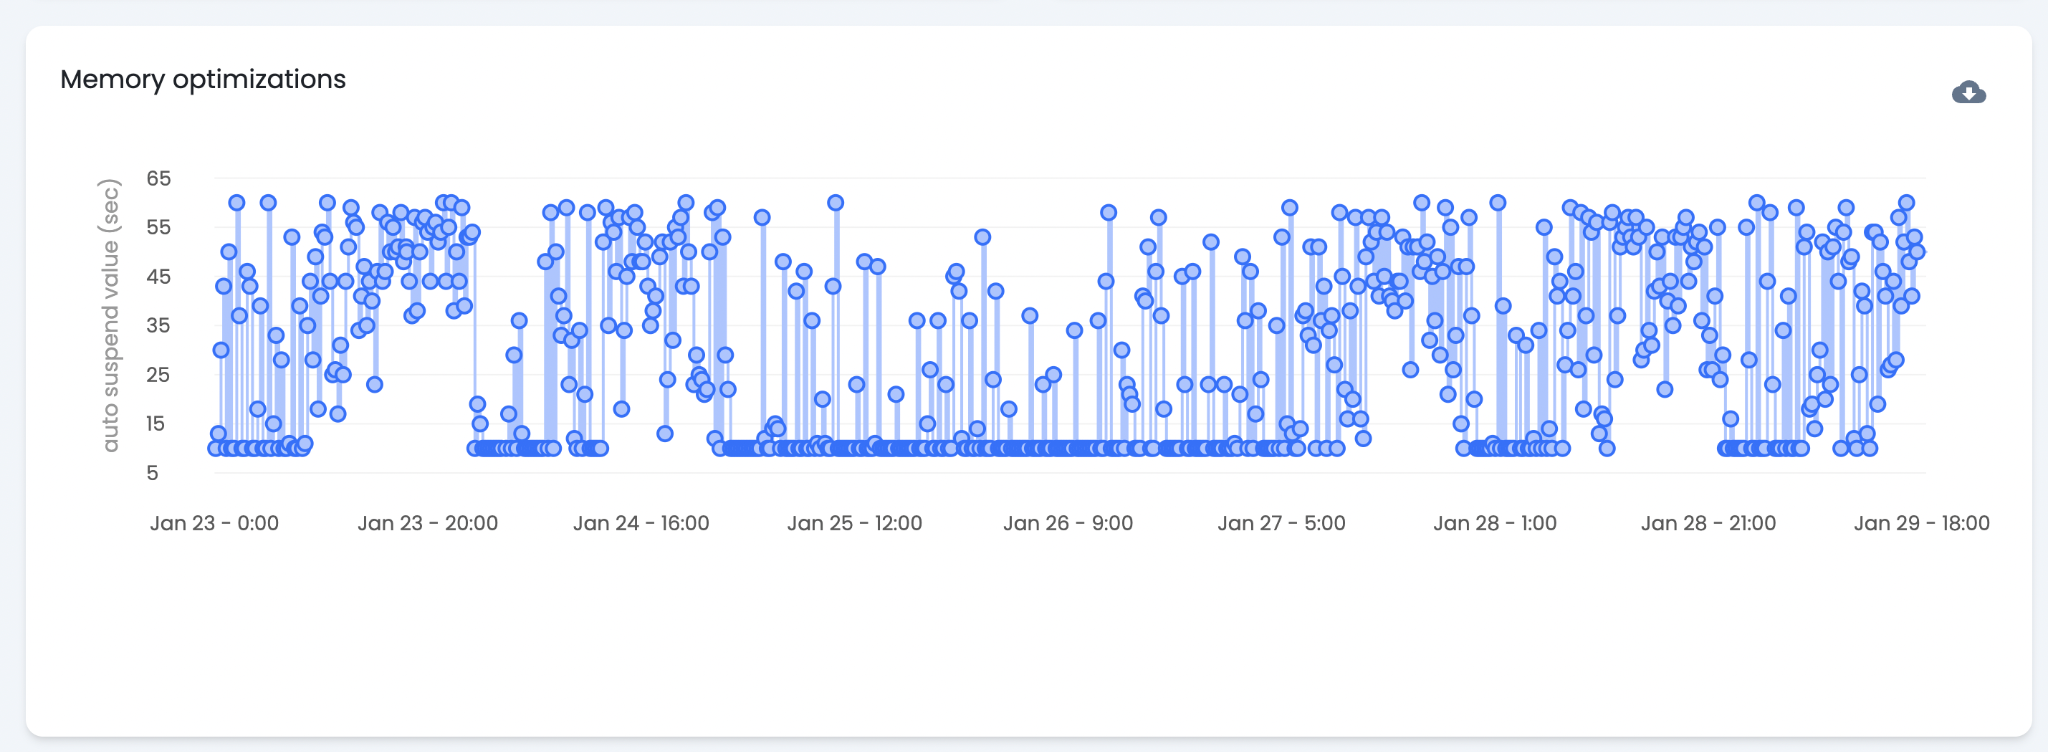
The "Memory Optimizations" chart shows when Warehouse Optimization adjusts the auto-suspend time of a warehouse. Auto-suspend is increased or decreased based on current and predicted workload. Increasing auto-suspend preserves the warehouse's cache, saving credits when consecutive queries can utilize that cache.
Memory optimizations do not trigger backoffs. They increase savings with minimal impact on warehouse performance.
How Do Multi-Cluster Optimizations Work?
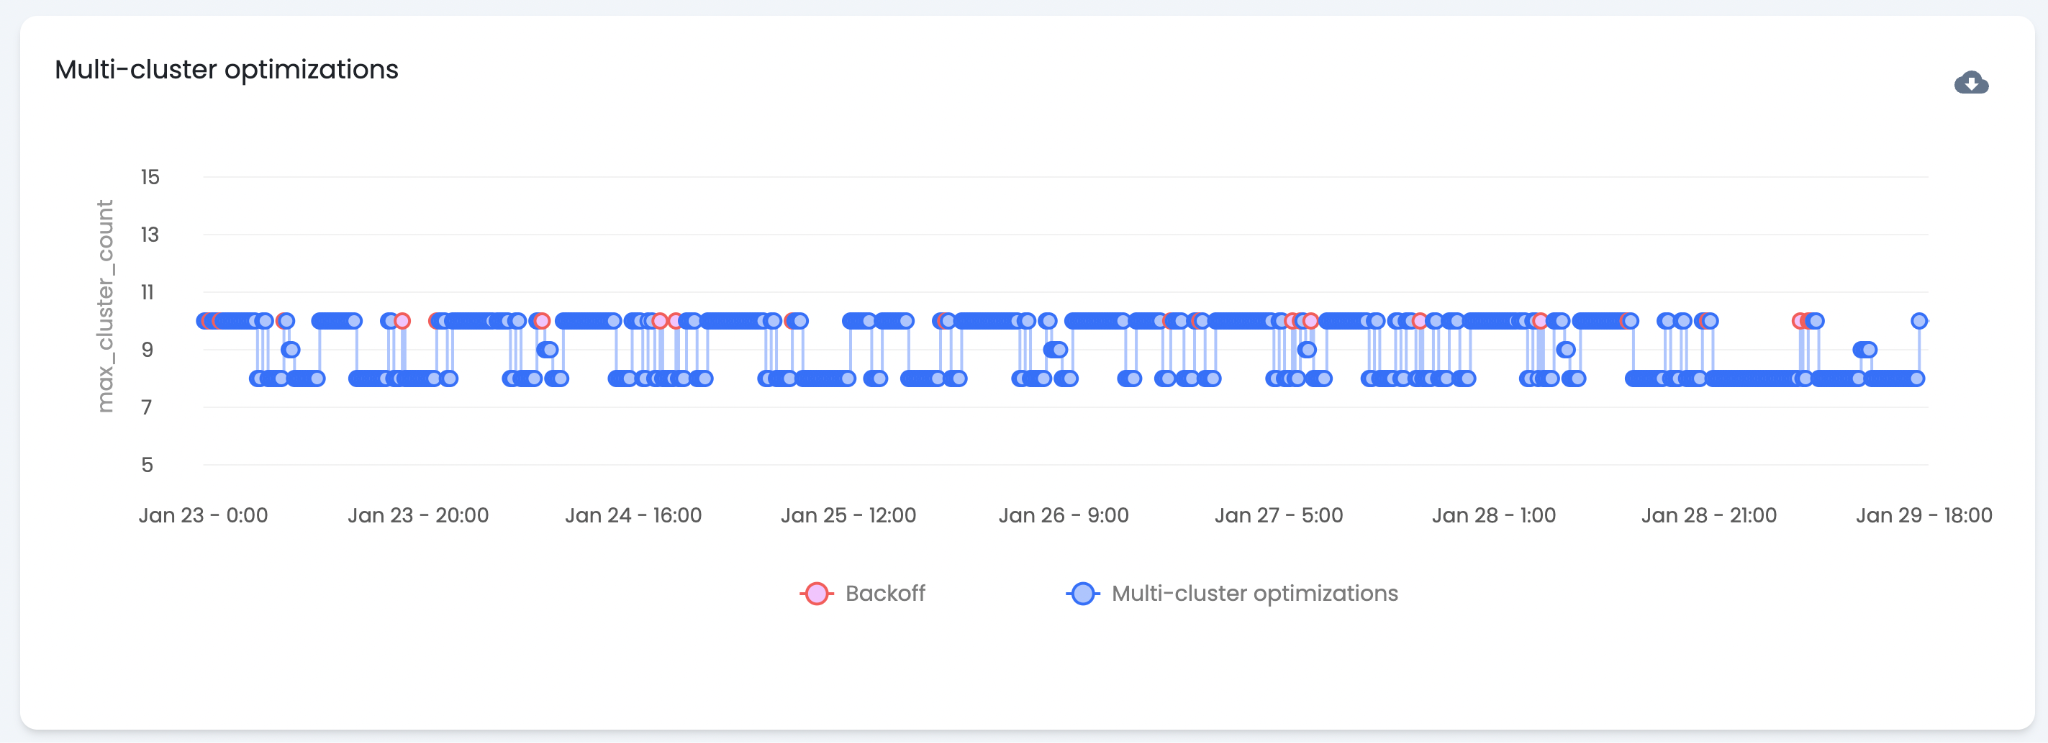
The "Multi-Cluster Optimizations" chart shows when Warehouse Optimization adjusts the max cluster count. Multi-cluster warehouses are an enterprise Snowflake feature — activity only appears for warehouses with this feature enabled. Warehouse Optimization decreases the max cluster count during periods of lower-than-normal workload. Each blue dot represents a decision to change or maintain the current count.
Backoff Behavior
Multi-cluster optimization backoffs are not governed by the performance guardrails on the Settings page. Multi-cluster changes primarily cause performance issues related to excessive queueing. A backoff triggers when the number of queued queries exceeds a threshold, preventing excessive queueing.
How Are Optimization Trends Analyzed?
The Optimization page supports analysis of optimization patterns over time. Comparing warehouse activity and performance metrics against optimization decisions informs adjustments to warehouse settings and optimization configuration.
Optimization Trends
Optimization charts typically show a clear correlation between optimizations and warehouse activity. Periods of high workload volatility often correlate with frequent optimizations — as workload changes, the ideal warehouse state also changes.
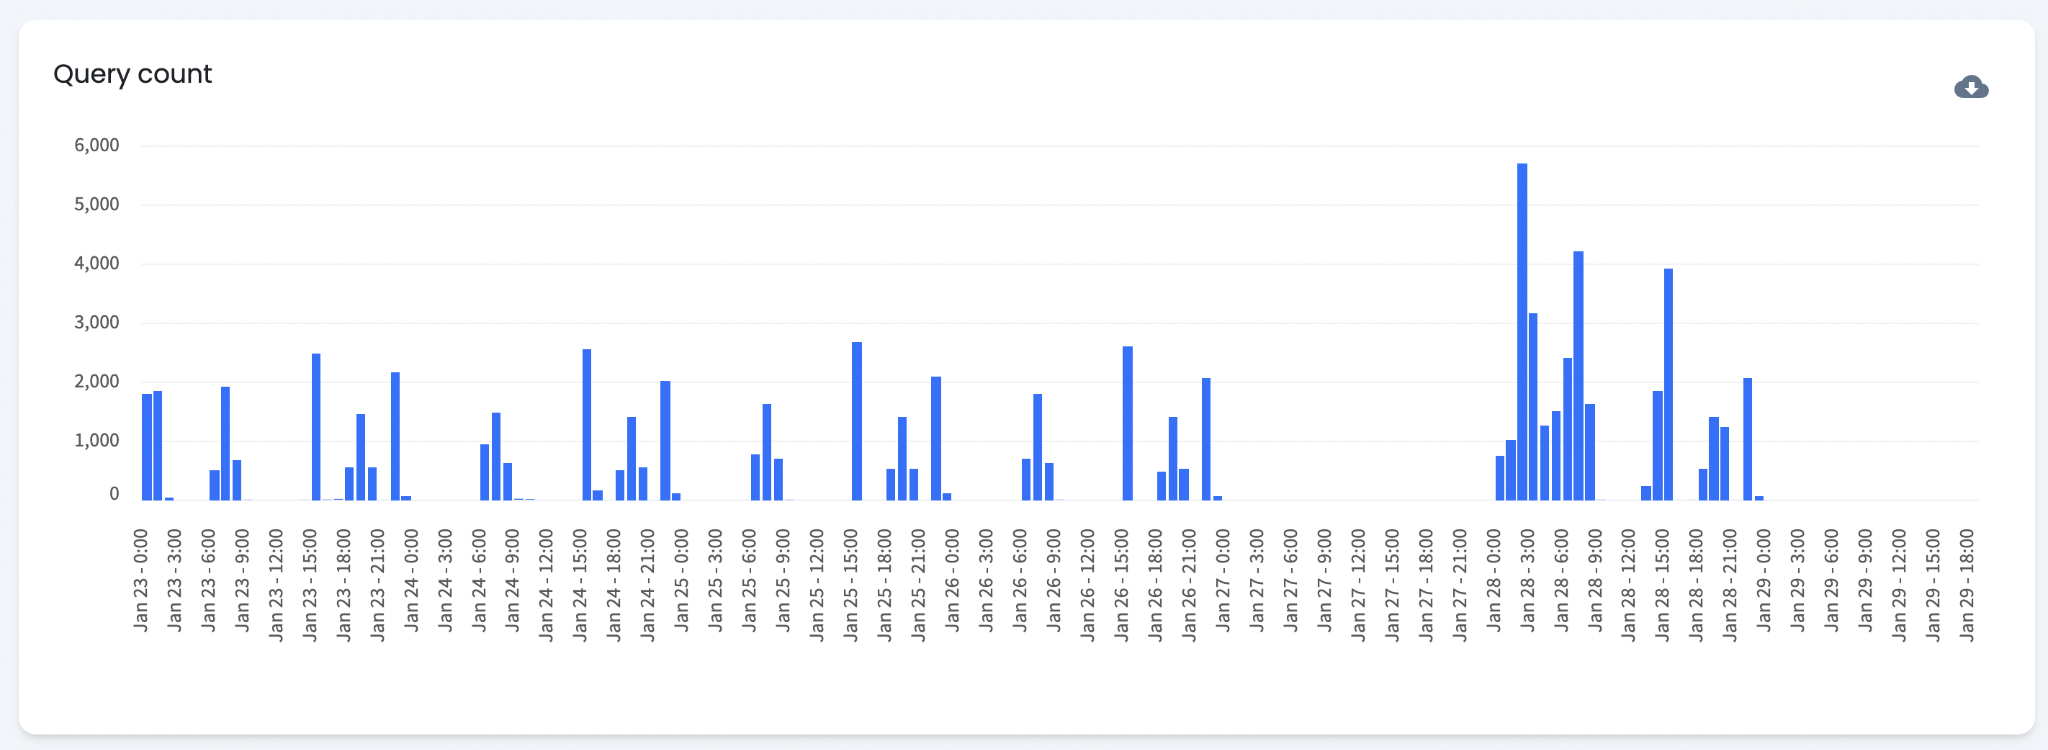
Query Count
The "Query Count" chart shows query volume over time for a warehouse. Query count provides a general indicator of warehouse activity. Queries vary in size — numerous small queries can cost the same as one large query. The "Warehouse Activity" chart provides a more complete view of how active a warehouse is.
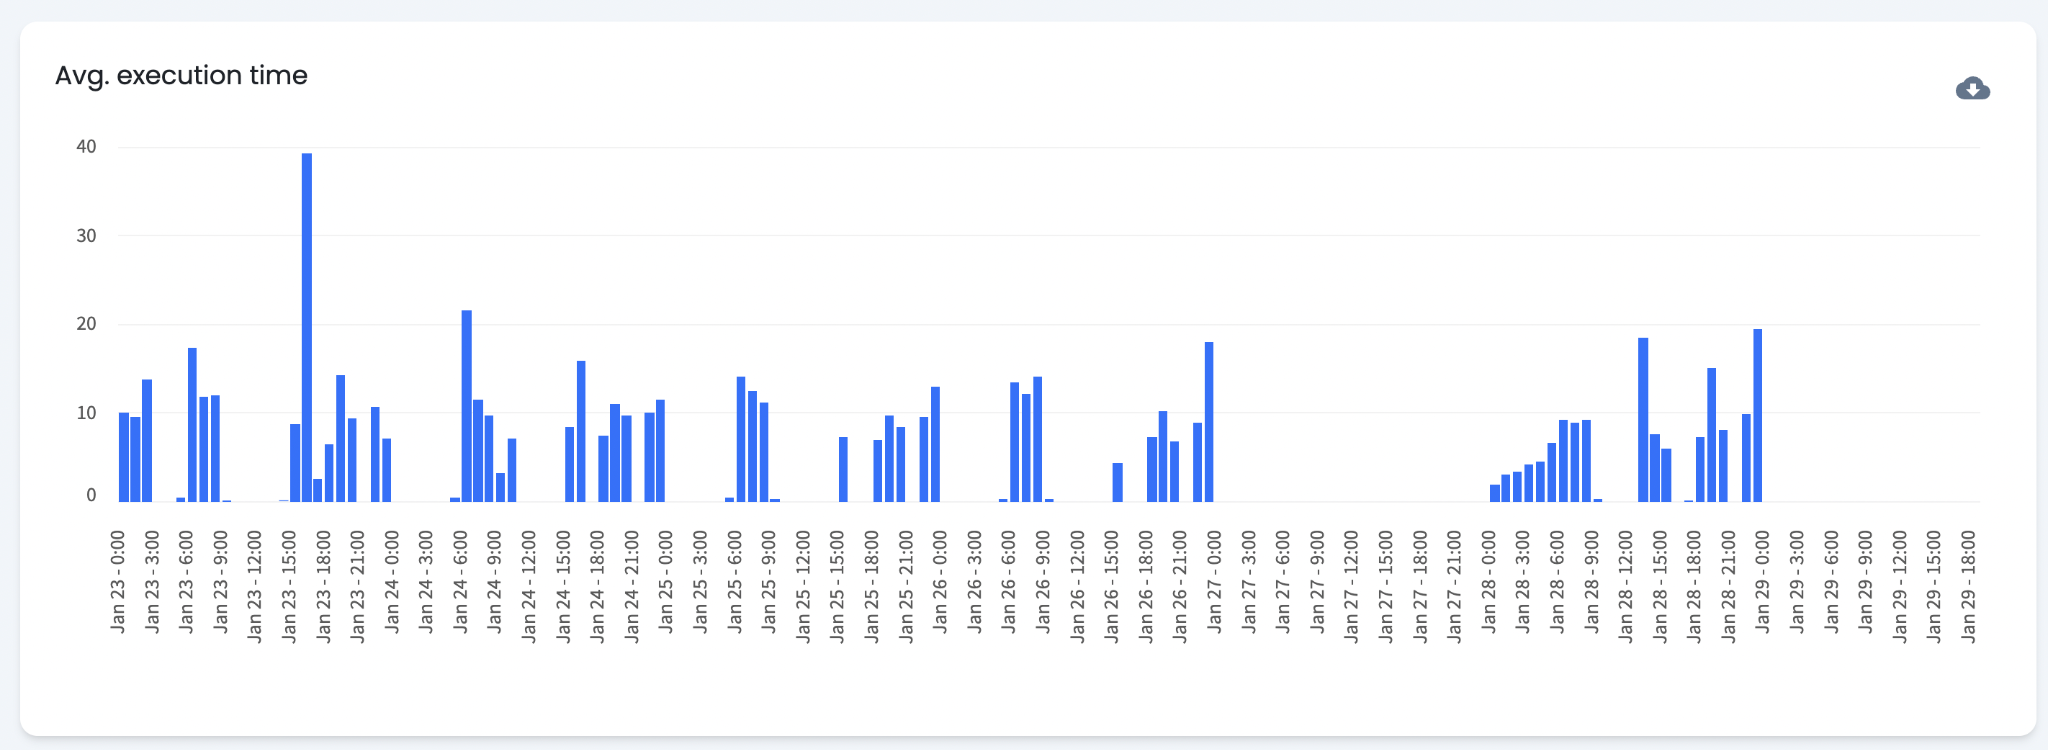
Average Execution Time
This chart shows average query execution time. High execution times may indicate low performance. Higher execution time directly increases per-query cost.
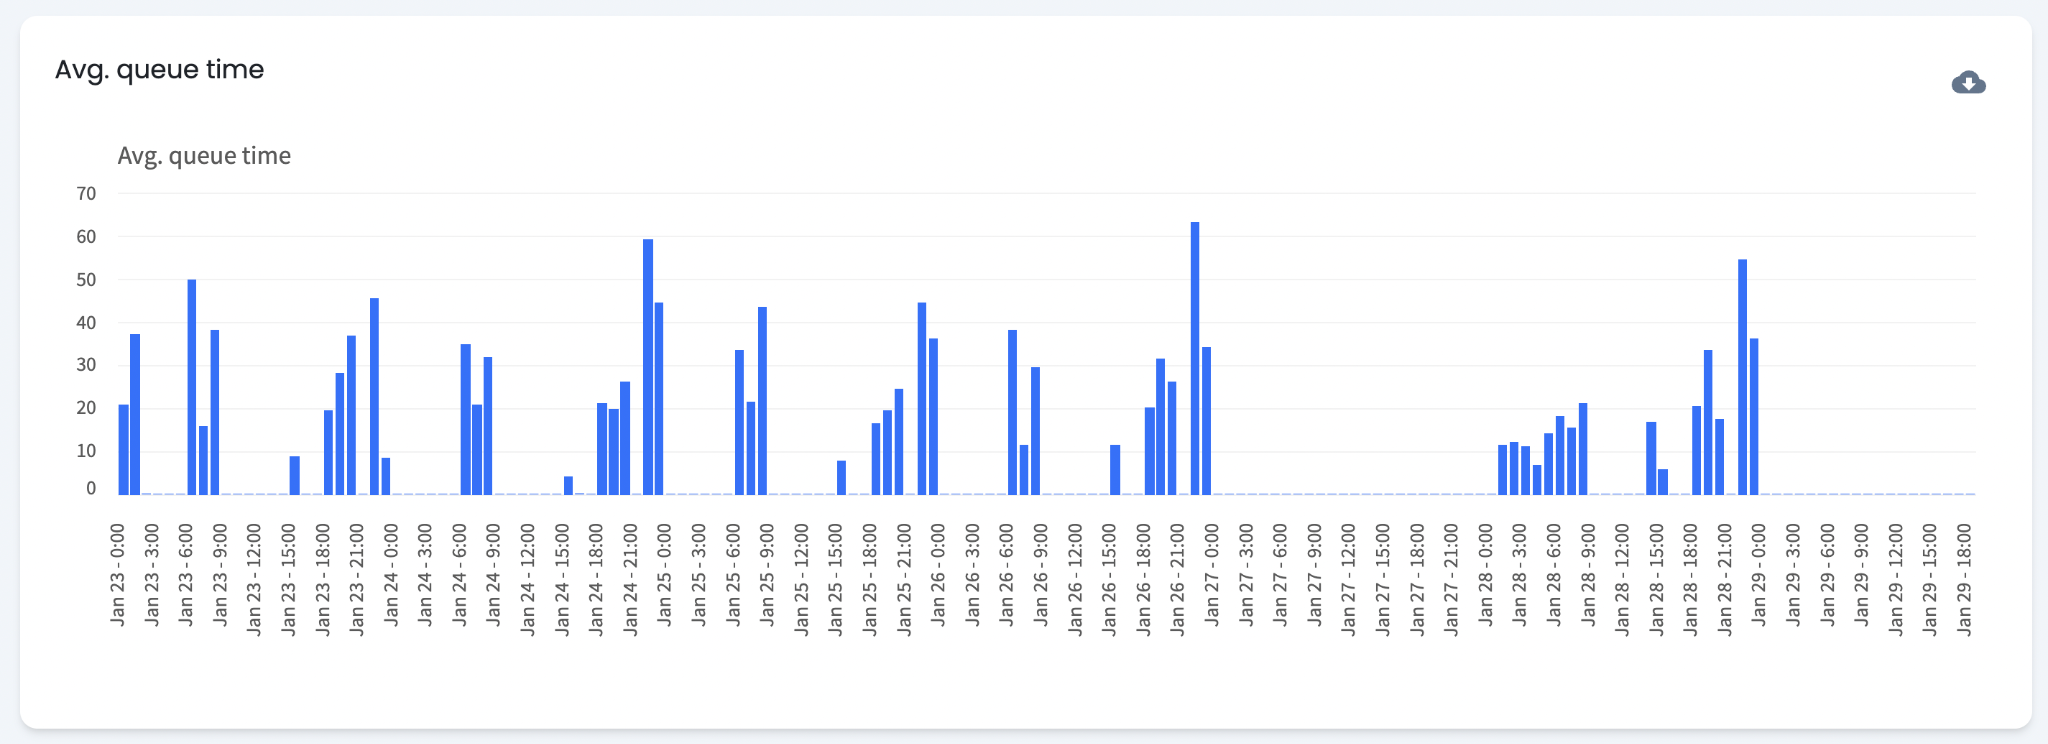
Average Queue Time
This chart shows average queue time. High queue times indicate that queries are waiting longer to execute. High queue times do not directly increase cost but indicate high warehouse activity at that time. Increasing warehouse size can lower queue time but also increases cost. Queue time can be used as a backoff condition to define a maximum acceptable queue duration.
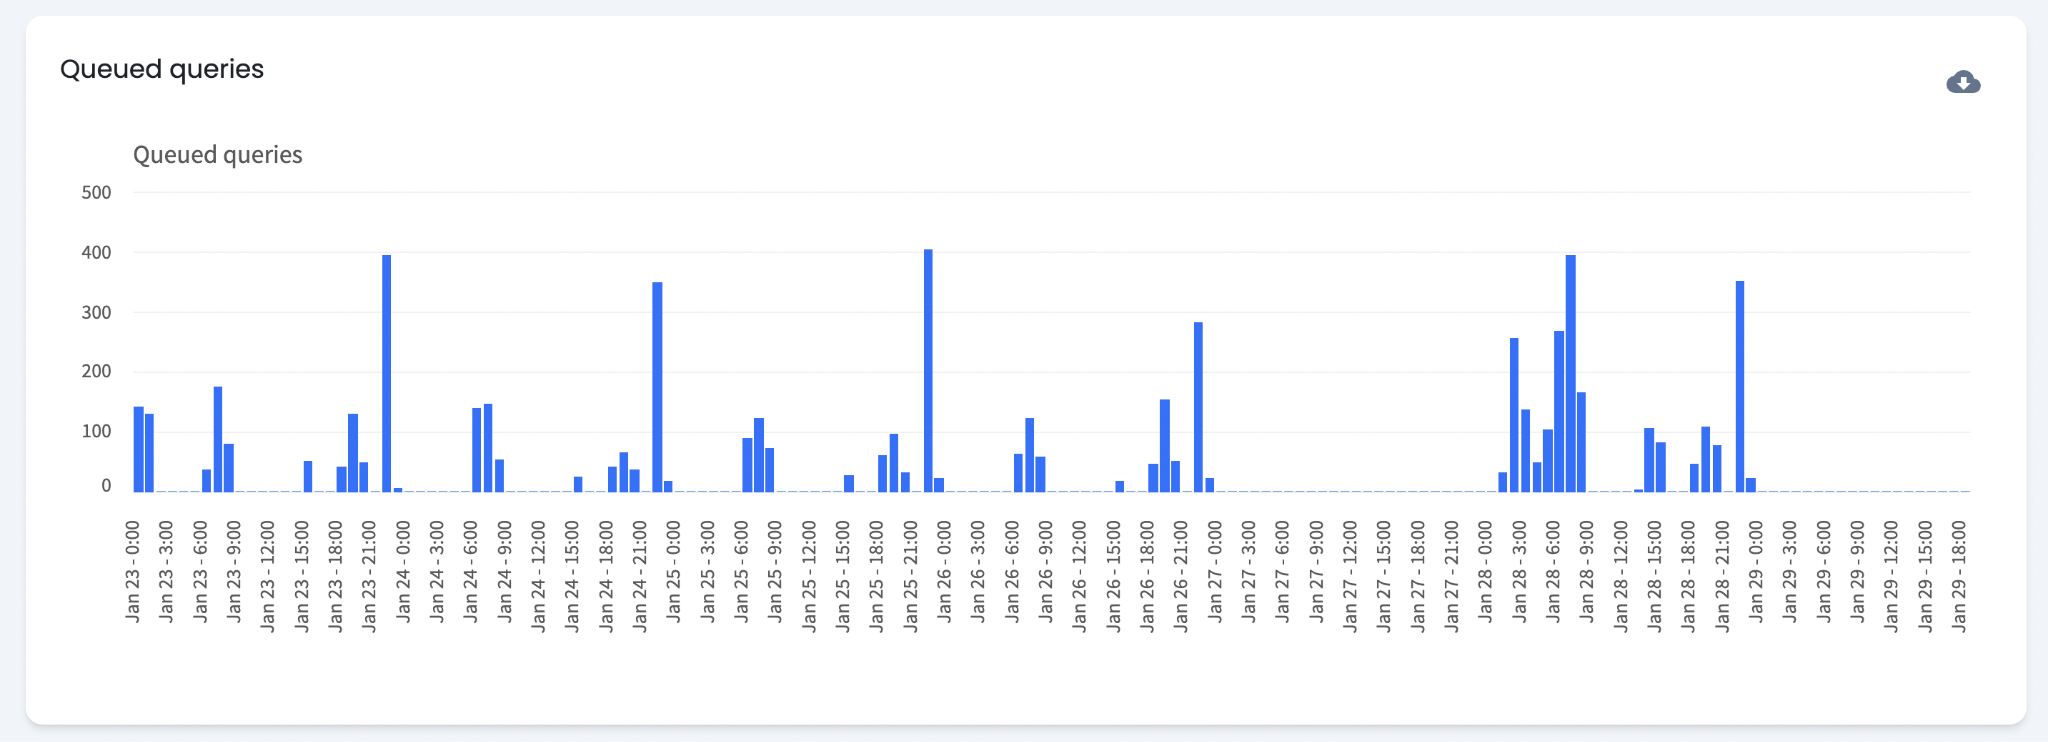
Queued Queries
This chart shows the total number of queued queries at any given time. High counts indicate that the warehouse is handling a larger query workload at that time. The total number of queued queries can be used as a backoff condition to define a maximum acceptable queue depth.
When Should Warehouse Default Settings Be Updated?
Continuous Backoffs
If Warehouse Optimization frequently backs off on a warehouse, the backoff criteria are being met regularly. Consider decreasing the warehouse's default size by one level.
Continuous Downsizes
If Warehouse Optimization almost always downsizes a warehouse, the default size may be larger than necessary. Consider decreasing the default size by one level.
When Should Optimization Settings Be Updated?
Increase Savings
If performance indicators are consistently within acceptable levels, increasing the aggressiveness slider produces greater savings.
Increase Performance
If performance indicators are frequently elevated, decreasing the aggressiveness slider improves warehouse performance.