The Dashboard
What Does the Dashboard Show?
The Warehouse Optimization dashboard provides an overview of query workloads and Snowflake credit savings. It is the first page displayed when entering the Keebo portal and is accessible from anywhere by clicking "Overview."
Dashboard Layout
The dashboard displays Snowflake spend, savings estimates, and query performance data. Filters allow customization by time period, account, warehouse, and label.
Snowflake Spend
Compares daily, weekly, and monthly Snowflake spending with and without Warehouse Optimization.
Savings
Displays an estimate of Snowflake credits saved over time. A detailed breakdown of the savings calculation methodology is included.
Query Performance
Compares warehouse query performance against Snowflake spend and savings, showing how optimization may affect query execution.
Filters and Customization
A variety of filters customize the dashboard view across different time periods and warehouse groups.
What Metrics and Charts Are Available?
Each section displays metrics and charts for the date range selected in the top-left corner.
Key Metrics
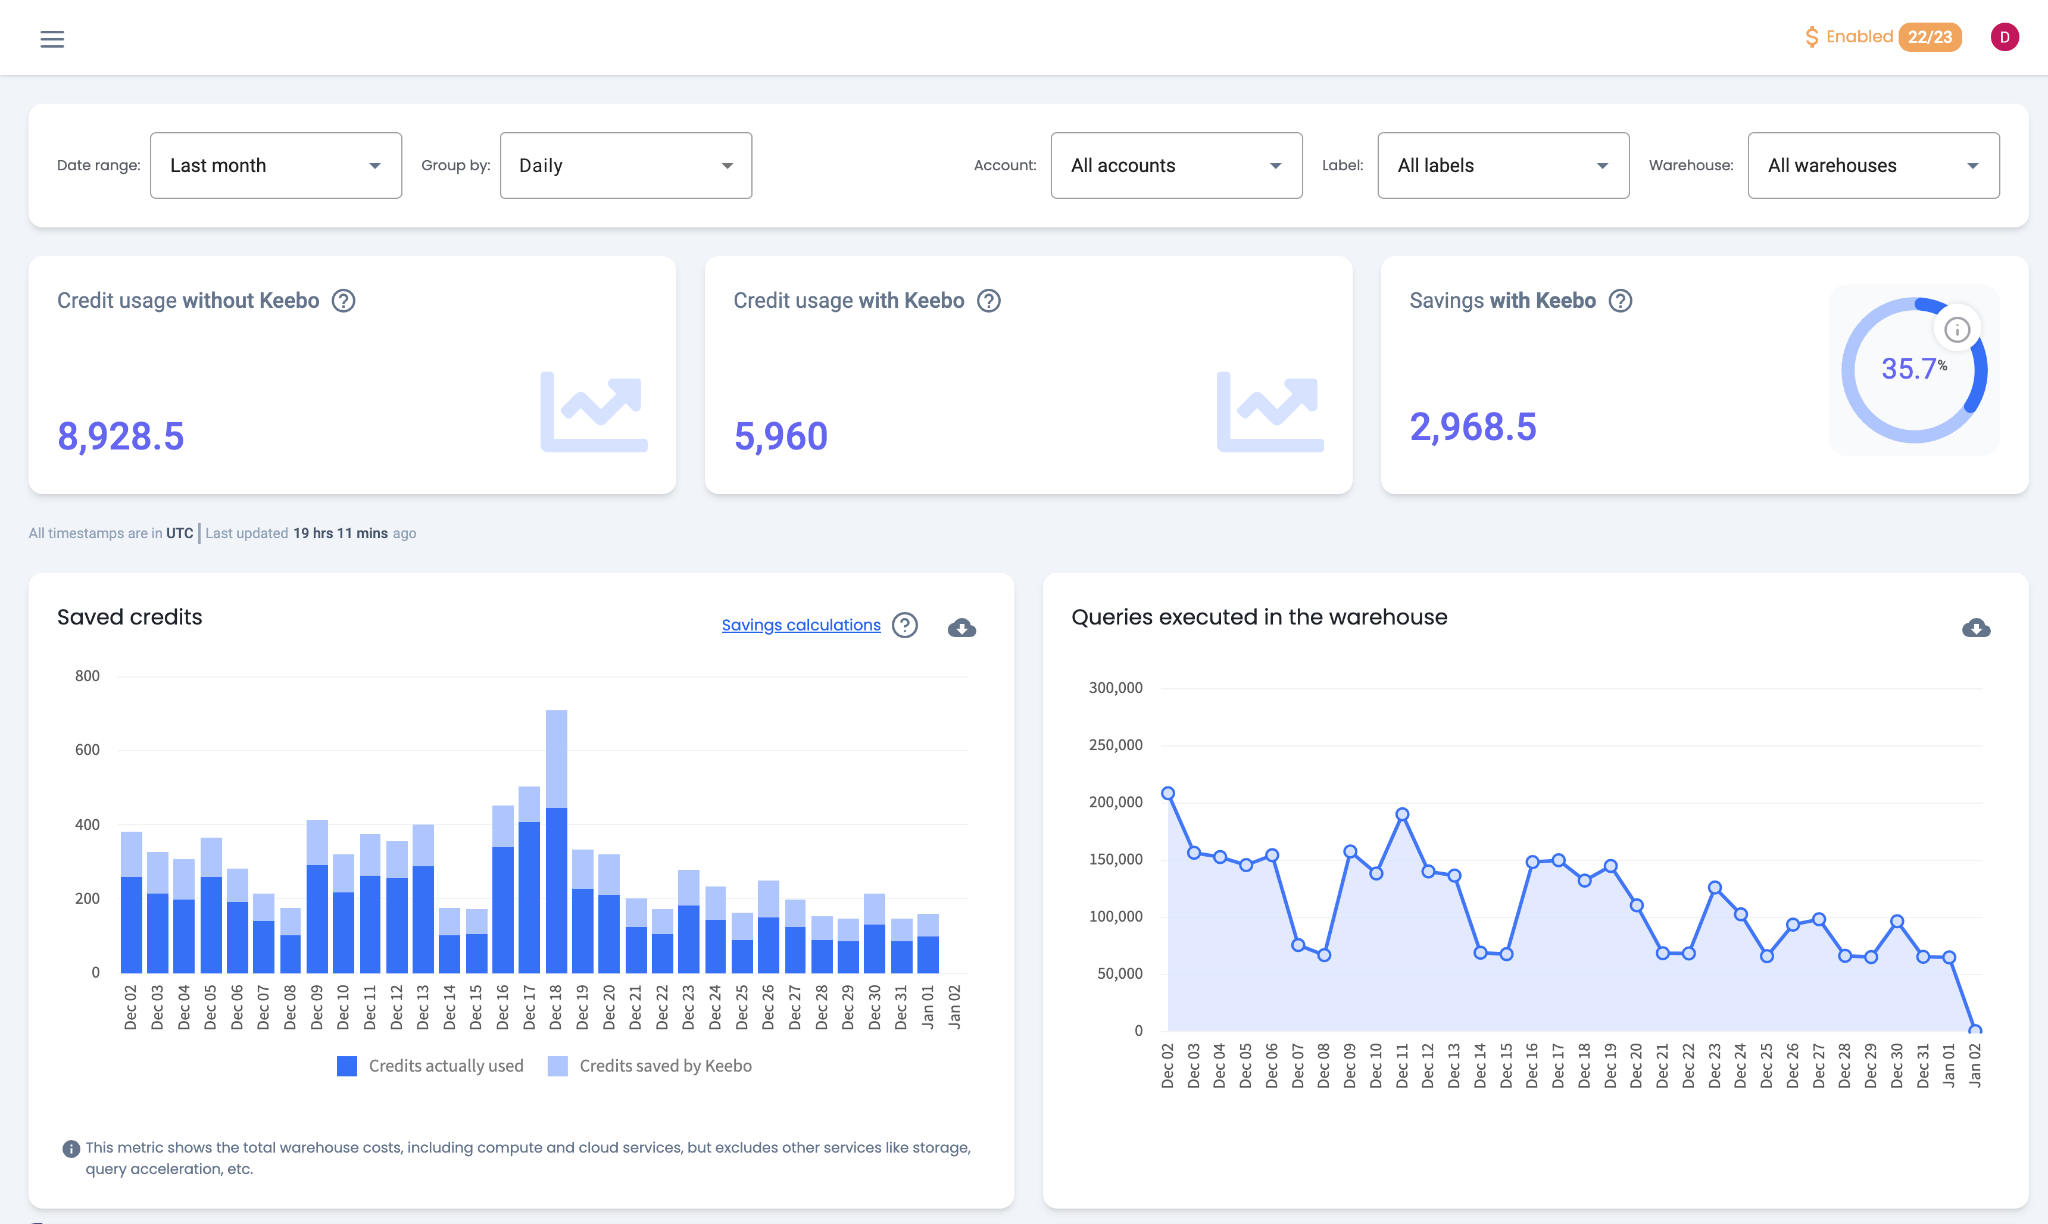
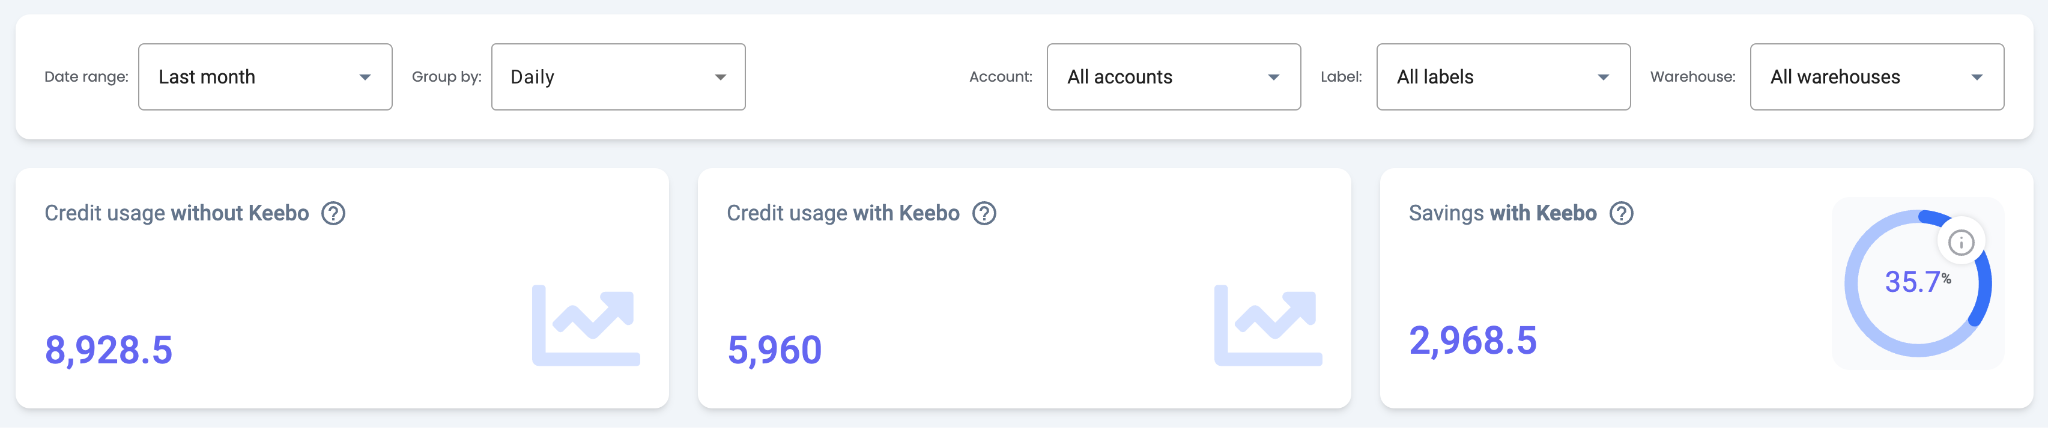
Three key metrics appear at the top of the dashboard:
- Credit Usage Without Keebo — Estimated credits that would have been used without Warehouse Optimization enabled.
- Credit Usage With Keebo — Actual credit usage of warehouses connected to Warehouse Optimization.
- Savings With Keebo — Estimated credits saved. The savings percentage is based only on warehouses with Warehouse Optimization enabled.
Saved Credits
This chart compares credits used against estimated savings. Hovering over a bar displays used credits, saved credits, and savings percentage. Used credits include total warehouse compute and cloud services cost but exclude other services such as storage and query acceleration. Click "Savings Calculations" for a detailed explanation of the savings methodology.
Queries Executed in the Warehouse
Displays the number of queries executed in connected warehouses over time. Comparing this chart to Saved Credits shows how query volume affects credit consumption. Executed queries do not correlate perfectly with credit consumption — each query consumes a different amount of credits, and workload variability reduces correlation.
Credits Per 1000 Queries
Shows how credit utilization changes over time. A decreasing trend indicates more queries per credit. This chart is most useful when query workloads remain consistent. An increase in this metric does not necessarily indicate worse utilization — it may reflect a shift to larger, more expensive queries. The "Percent of Time Keebo Was On" metric also appears on this chart for comparison.
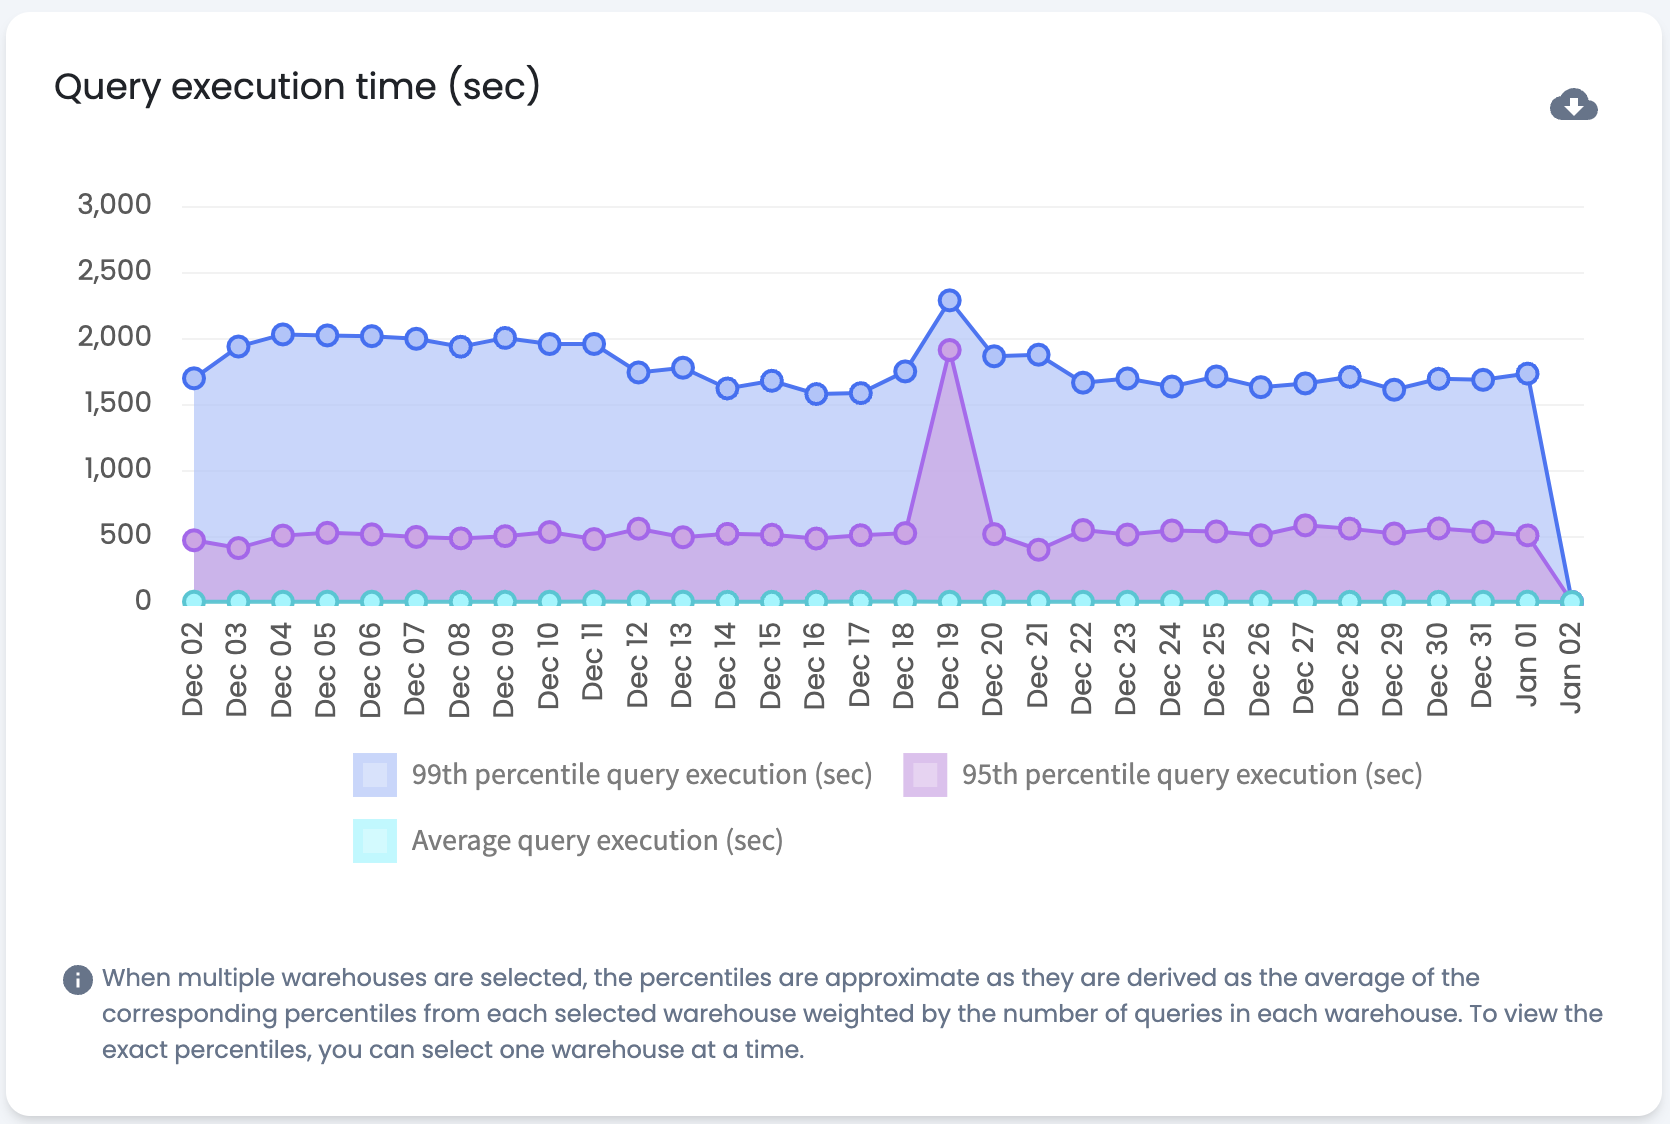
Query Execution Time
Compares the 99th percentile, 95th percentile, and average query execution time. Selecting multiple warehouses produces estimates. Selecting a single warehouse displays exact execution times.
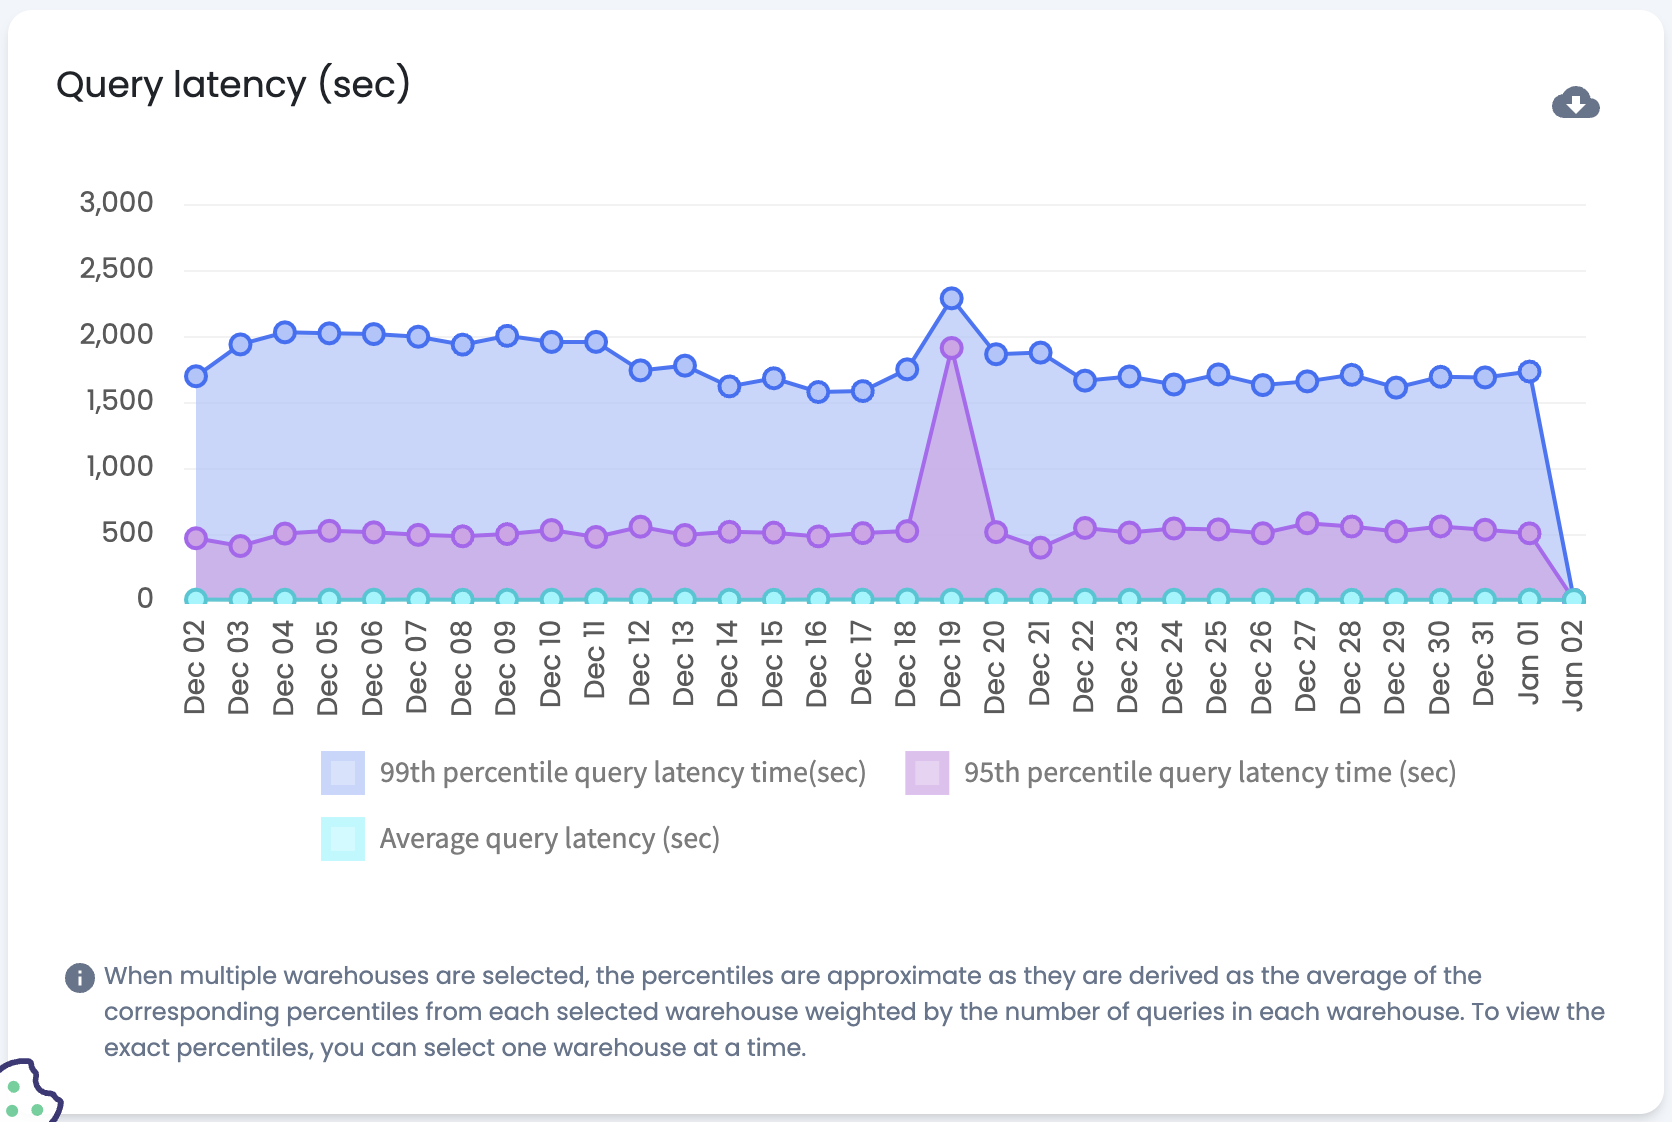
Query Latency
Compares the 99th percentile, 95th percentile, and average query latency. Selecting multiple warehouses produces estimates. Selecting a single warehouse displays exact latency values.
How Is Overall Performance Analyzed?
The dashboard supports ongoing monitoring of Warehouse Optimization performance. As configuration changes are made, the dashboard reflects their impact on savings and query performance.
How Are Key Performance Indicators Interpreted?
Savings
"Savings With Keebo" and the "Saved Credits" chart are the primary KPIs. The amount of savings depends on several factors. Warehouse Optimization generally saves more on warehouses with variable workloads — for example, complex long-running queries at night and smaller queries during the day. Warehouse Optimization predicts these patterns and optimizes accordingly. Enabling optimization on as many warehouses as possible maximizes savings.
Query Execution Time and Latency
These KPIs reflect warehouse query performance. The goal is to maintain steady execution time and latency while reducing costs. A significant increase in either metric may indicate under-provisioned warehouses — consider adjusting the default warehouse size. Consistently elevated execution time or latency may require adjusting the optimization aggressiveness slider or adding guardrails.
How Is Optimization Impact Visualized?
As algorithms are adjusted and warehouses are added, results appear in the dashboard charts. Setting the time range to span from the initial connection date to the present provides an immediate view of impact.
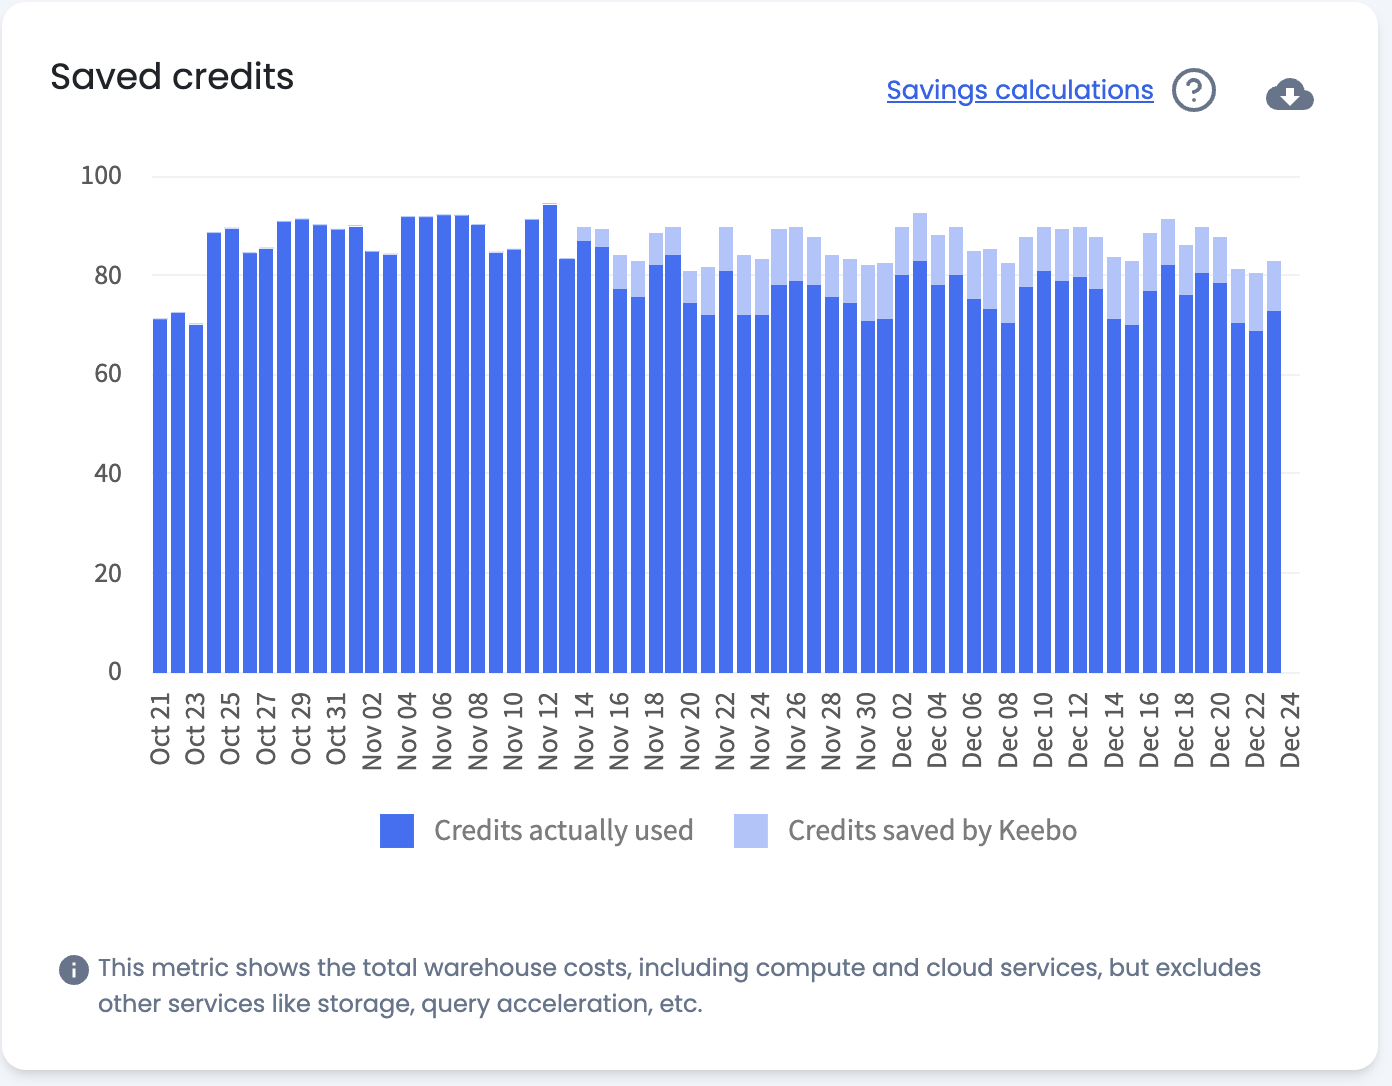
Saved Credits Example
The example above shows a "Saved Credits" chart where Warehouse Optimization was connected mid-November. "Credits Actually Used" decreases after connection. The sum of "Credits Actually Used" and "Credits Saved by Keebo" approximates the pre-optimization credit usage. This example reflects warehouses with a consistent workload before and after optimization. Different workload patterns may produce different results.
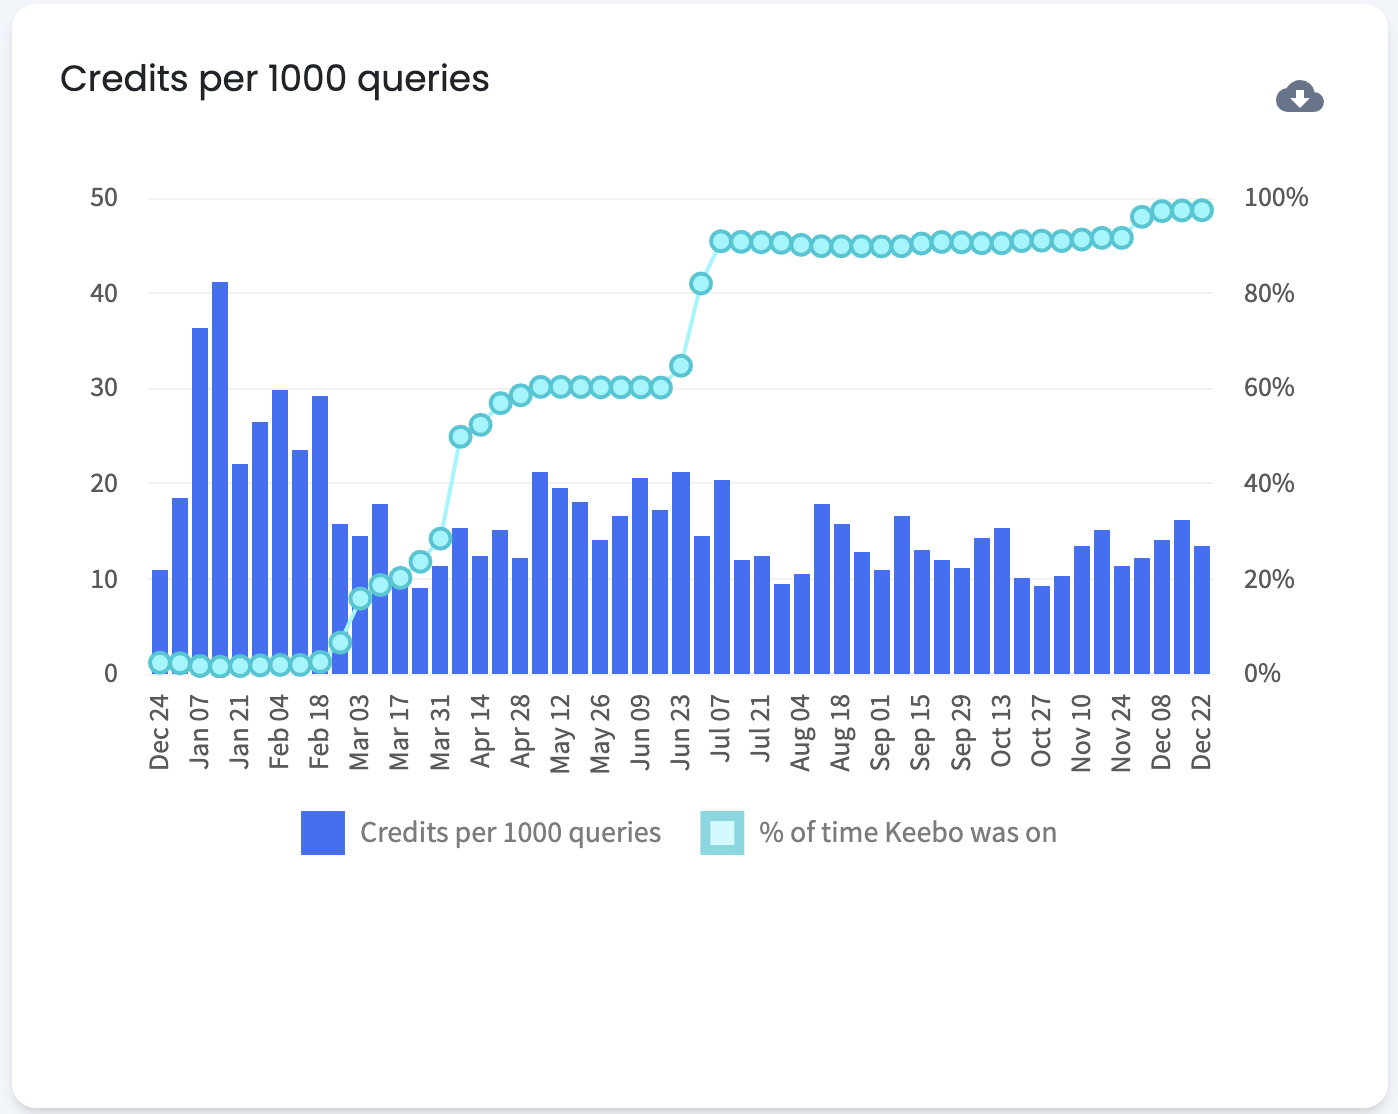
Credits Per 1000 Queries Example
The example above shows "Credits Per 1000 Queries" decreasing as Warehouse Optimization was enabled on more warehouses. This demonstrates that optimizing more warehouses improves credit efficiency. This example reflects a consistent query workload. If query workloads change — for example, larger or more complex queries are introduced — "Credits Per 1000 Queries" may increase despite optimization.
How Are Dashboard Views Customized?
Several filters are available to customize the dashboard for performance analysis:
- Date range — Defaults to "Last Week." Supports any range within the past two years, as well as presets: "Last Month," "Last 3 Months," "Last Year," and "Year to Date."
- Group by — Defaults to "Daily." Options include "Weekly" and "Monthly."
- Account — Selects which Snowflake accounts appear in charts. All connected accounts are selected by default.
- Warehouses — Selects which warehouses appear in charts. All connected warehouses are selected by default.
- Label — Filters warehouses by label. All labels are selected by default. A single label, group of labels, or all warehouses with no labels can be selected. Labels are assigned on the Settings page.