Warehouse Health
What Does the Warehouse Health Overview Show?
The "Warehouse Health" overview table provides insight into the health of warehouses in an account. Navigate to the table by clicking "Warehouse Health" in the left-hand menu. The table includes several columns for identifying warehouses that may need optimization.
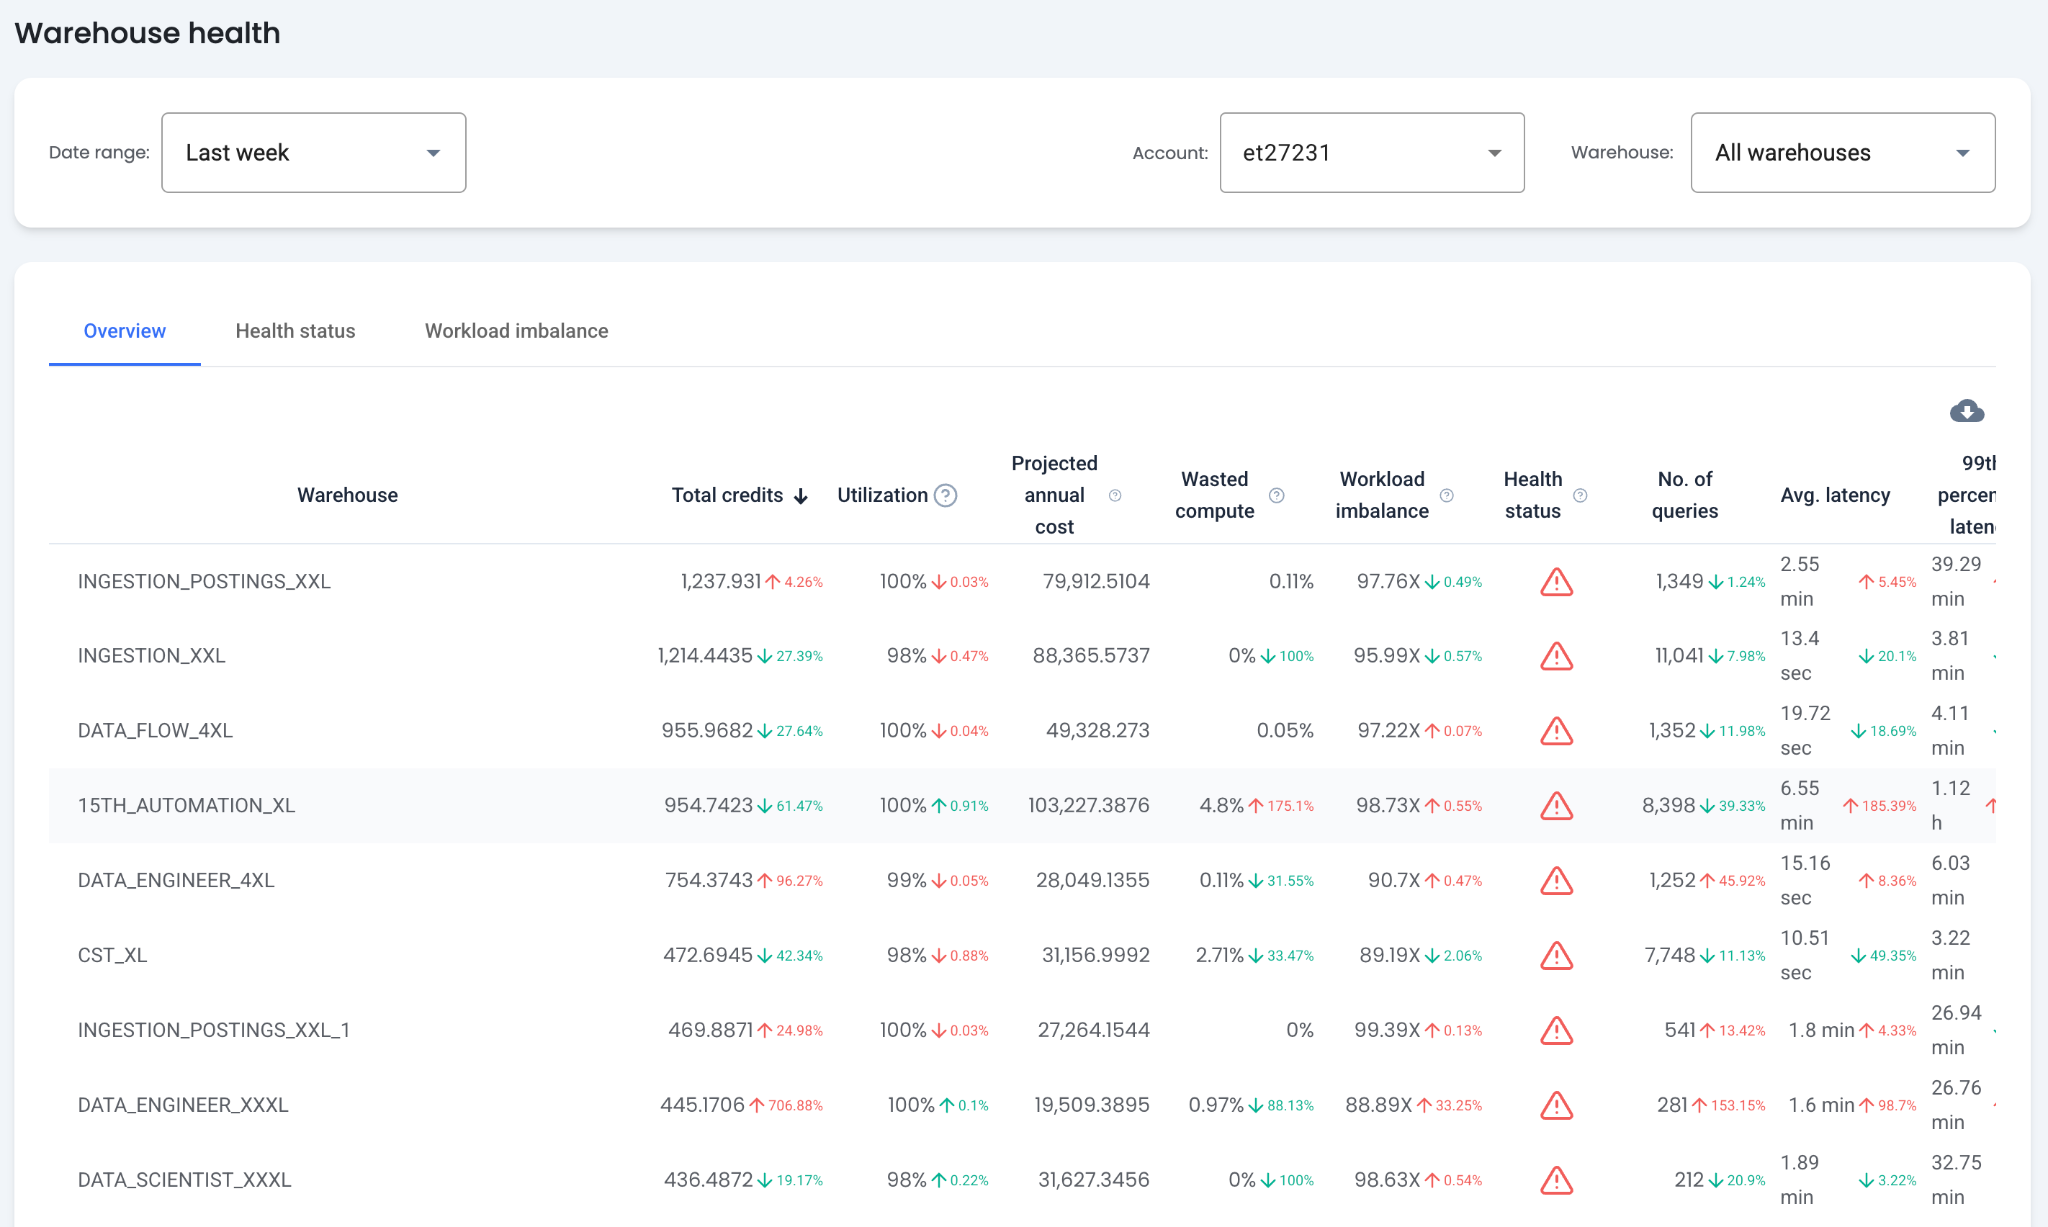
Table Columns
- Total Credits — By default, the table is sorted by the warehouse consuming the most Snowflake credits. These warehouses benefit most from optimization.
- Projected Annual Costs — The cost from the past month linearly scaled to a yearly projection.
- Number of Queries — Total queries run on the warehouse for the selected time range.
- 99th Percentile Latency — The 99th percentile latency for queries run on the warehouse. A high value may indicate performance issues.
- Total Bytes Scanned — The total data scanned by queries run on the warehouse.
- Local and Remote Bytes Spilled — The total local and remote spillage for queries run on the warehouse. Warehouses with the highest spillage may have low performance or higher costs.
- Average Queued Query Time — The average query queue time, calculated from
QUEUED_PROVISIONING_TIME,QUEUED_REPAIR_TIME, andQUEUED_OVERLOAD_TIME.
Warehouse Utilization
This metric measures how efficiently a warehouse is utilized by considering both the workload and credit consumption. A high value indicates queries are running close to the warehouse's full capacity. A low value may indicate underutilization or inefficient credit usage.
Measurement: Warehouse utilization is measured by assessing how much load each query places on the warehouse and combining these to understand overall resource usage. Formula: sum(QUERY_CREDITS * QUERY_LOAD_PERCENT) / sum(QUERY_CREDITS)
Wasted Compute
This metric indicates how much of the warehouse's compute is consumed by failed queries. Failed queries produce no results and are typically rerun until they succeed, making this compute wasted.
Measurement: Percentage of the execution time of failed queries compared to the total execution time of all queries.
Workload Imbalance
The Imbalance Factor evaluates the uniformity of query workloads in a warehouse. Higher values indicate more significant imbalances, suggesting the warehouse processes a mix of different query types. Warehouses with an imbalance factor exceeding 30X are considered imbalanced.
Measurement: Imbalance Factor = (total execution time of all outlier queries) / (total execution time of all queries) * 100.
Health Status Indicators:
- Well Optimized — Factor less than 30X
- Room for Improvement — Factor between 30X and 59X
- Significant Optimization Needed — Factor greater than 60X
What Does the Health Status Tab Show?
The Health Status table provides health status, diagnoses, and recommendations for each warehouse.
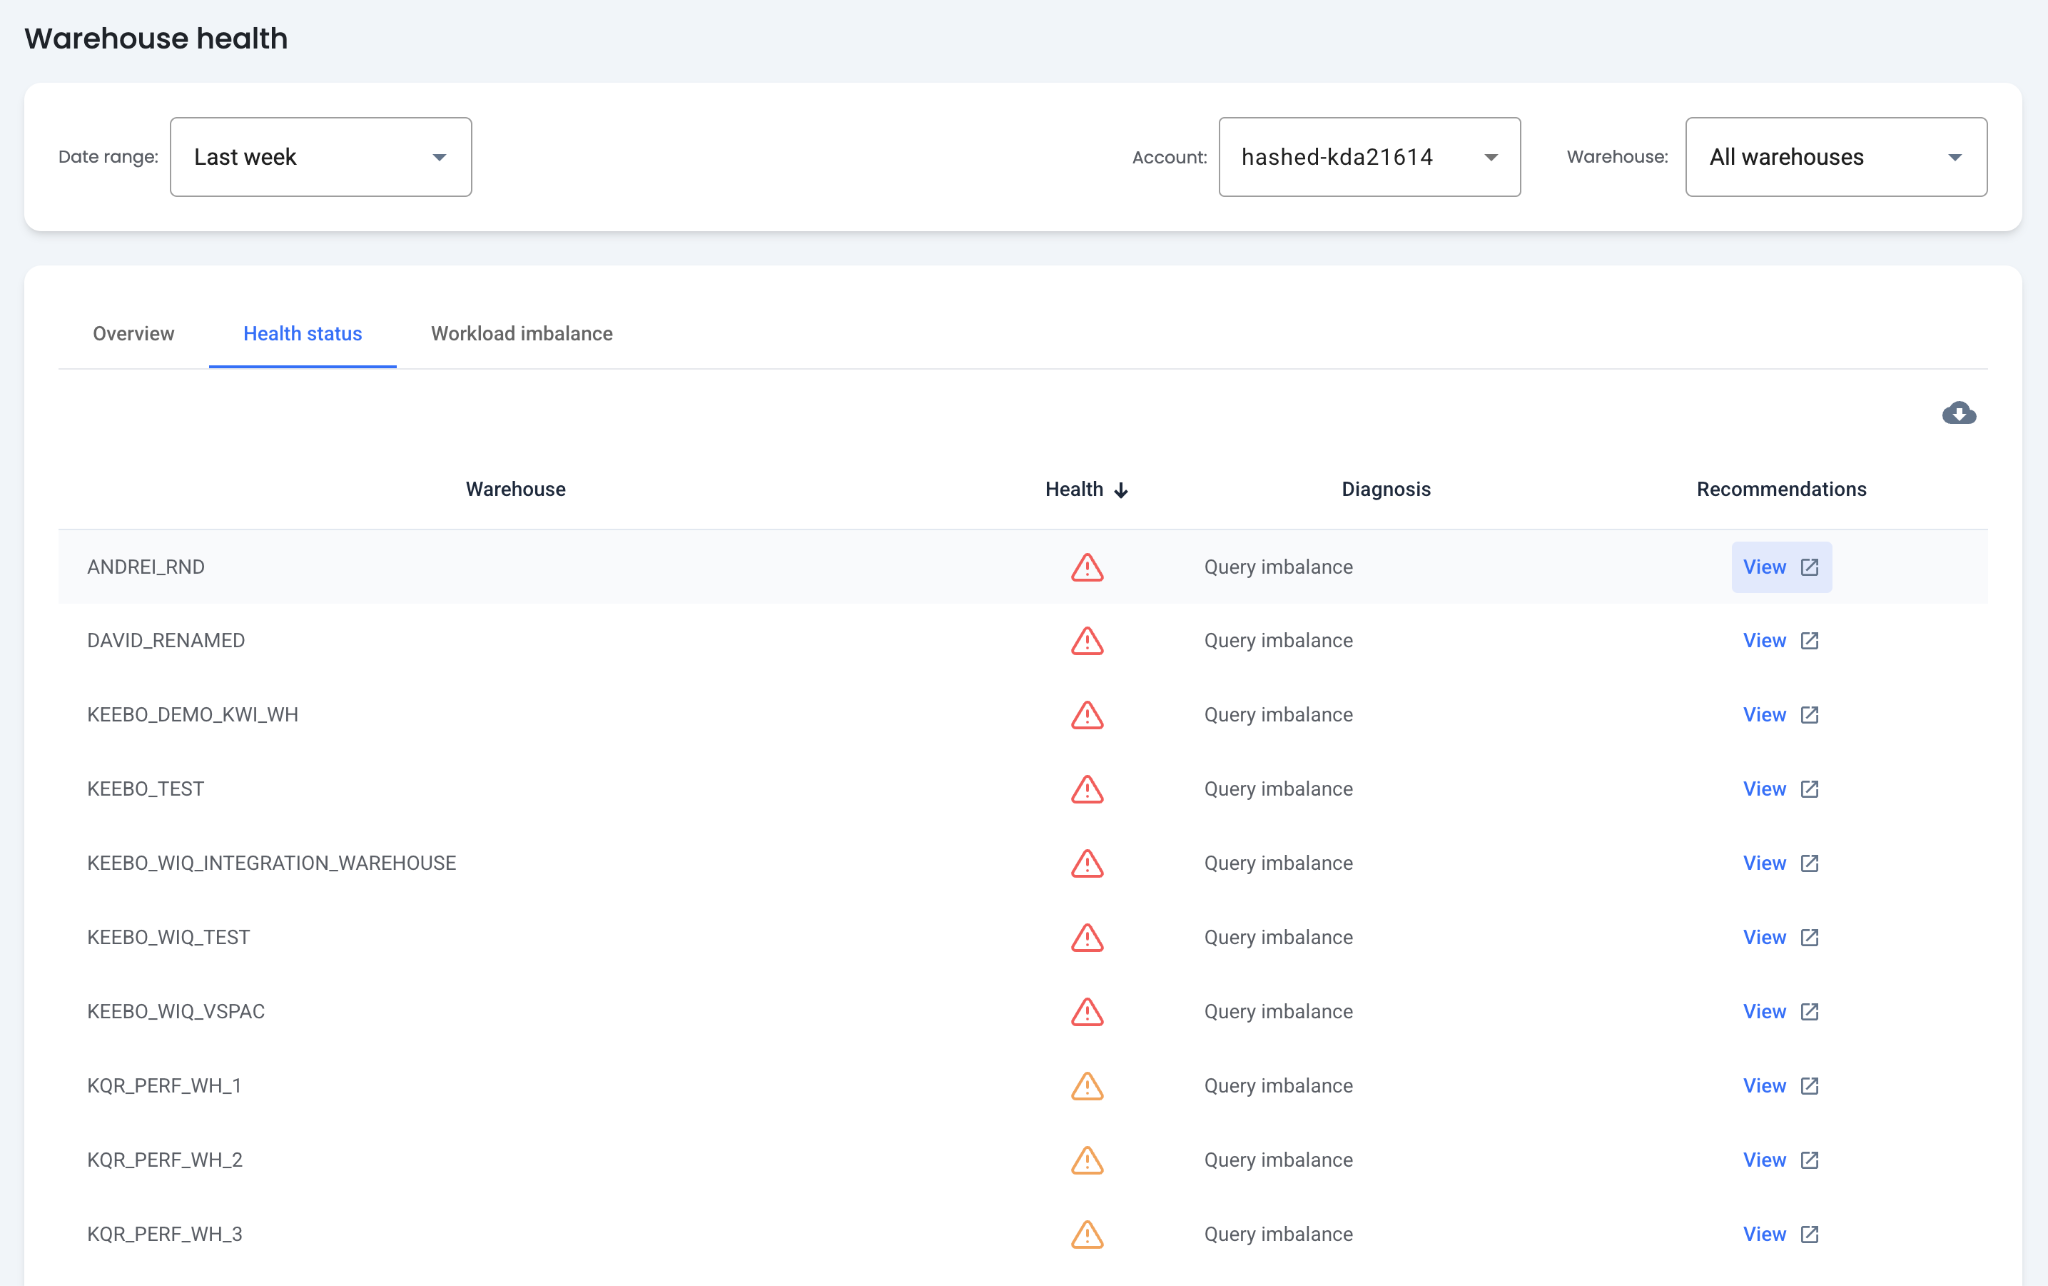
What Diagnoses Are Available?
Each warehouse is classified as either healthy or unhealthy. Unhealthy warehouses display up to three diagnoses: memory inefficient, underprovisioned, and query imbalance.
- Memory Inefficient — The warehouse is not caching data effectively. Consider increasing the autosuspend value.
- Query Imbalance — The warehouse has a high workload imbalance. Consider migrating some queries to other warehouses.
- Underprovisioned — The average query running on the warehouse is too large for it to run efficiently.
How Are Recommendations Applied?
Memory Inefficient
A warehouse is considered memory inefficient when its queries scan 20% more remote bytes when compute resources are already available compared to when it must provision additional resources. Consider increasing the autosuspend value.
Impact of memory inefficiency:
- Inefficient queries: This implies the warehouse is not caching data effectively or not using local storage efficiently.
- Increased costs: Inefficient queries can lead to longer execution times, which leads to high cost per query
- Performance issue: Inefficient queries can lead to longer execution times, which can be seen as a performance issue by users.
- KWO optimization: KWO can lower the autosuspend value as needed to balance costs and performance.
Query Imbalance
For warehouses with a high workload imbalance, consider migrating queries to another warehouse. Migrating any query whose execution time is 10 times higher than the warehouse average is recommended.
Impact of query imbalance:
- Performance issue: Latency 10x higher than average may cause significant issues for users, depending on the use case.
- Warehouse bottleneck: Long-running queries can increase queue time and create warehouse bottlenecks. Running them in a dedicated or larger warehouse may resolve this.
- Cost: These queries may be too large for the warehouse and could cost less on a larger warehouse.
Underprovisioned
A warehouse is considered underprovisioned if the percentage of queries with spillage to remote or local storage exceeds 5%. Consider increasing the warehouse size.
Impact of underprovisioning:
- Query Queueing: Underprovisioned warehouses may have many queued queries and long execution times. A larger warehouse can reduce wait times.
- Resource bottlenecks: Data spilling to disk slows down execution significantly.
- Consumption costs: In some cases, underprovisioned warehouses consume more credits than a properly sized warehouse. For example, a query that takes 30 minutes on a small warehouse may take only 10 minutes on a large warehouse.
What Does the Workload Imbalance Tab Show?
The Workload Imbalance table displays the imbalance factor and query migration recommendations for each warehouse. Use this table to optimize and balance warehouses by migrating queries.
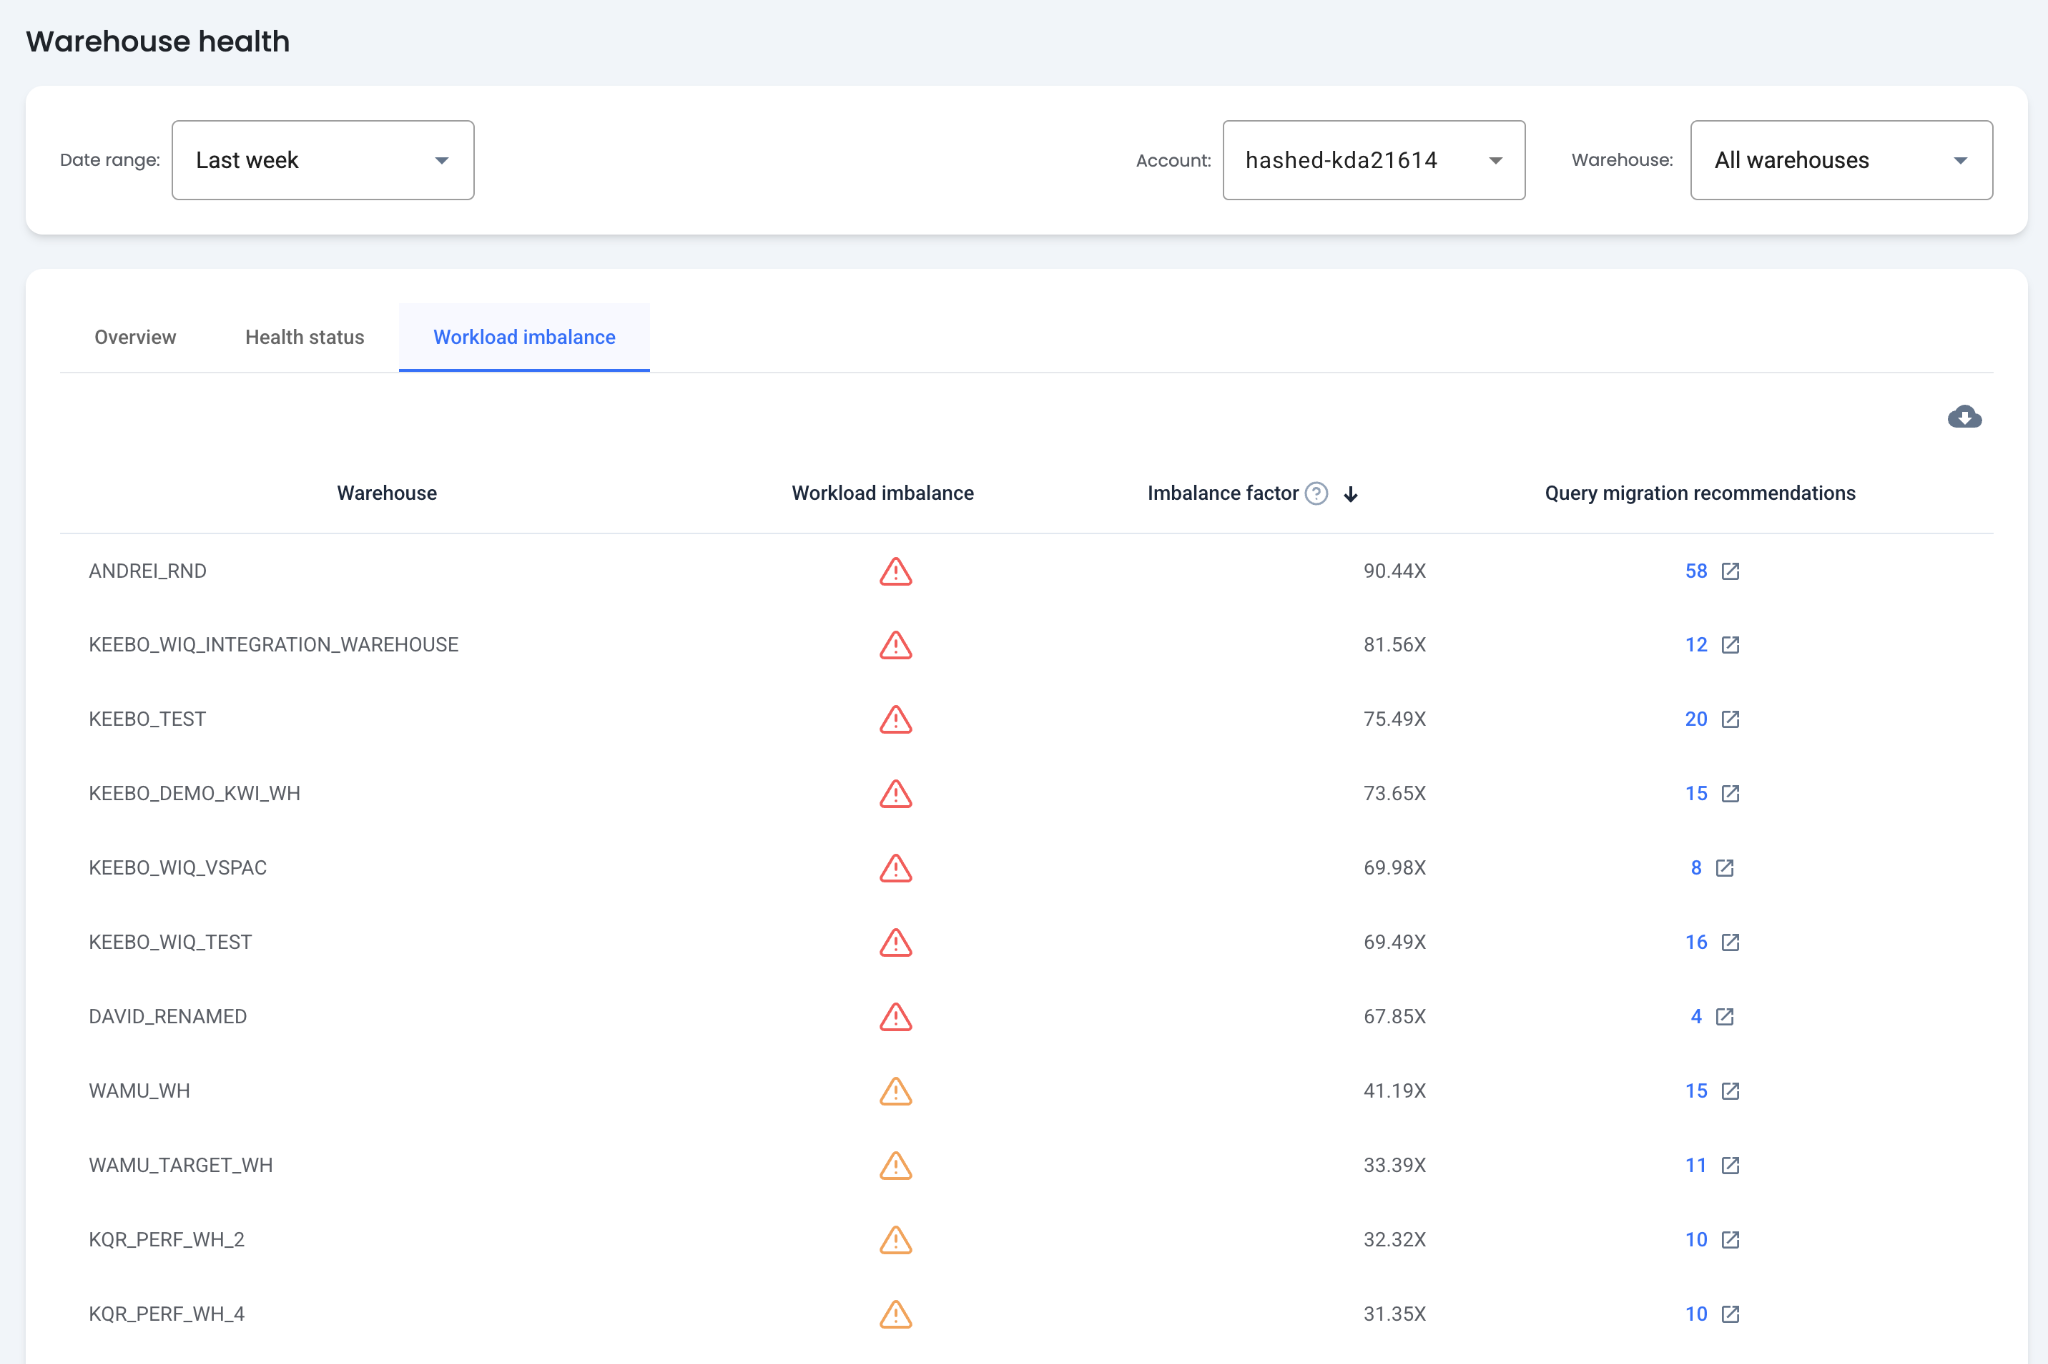
How Is the Imbalance Factor Calculated?
The imbalance factor evaluates the uniformity of query workloads in a warehouse. Higher values indicate more significant imbalances, suggesting the warehouse processes a mix of different query types.
Measurement: Warehouses with an imbalance factor exceeding 30X are considered imbalanced. Formula: Imbalance Factor = (total execution time of all outlier queries) / (total execution time of all queries) * 100
How Are Query Migration Recommendations Applied?
Clicking the query migration recommendations for a warehouse shows a list of queries suggested for migration. These queries have an average latency 10 times larger than the warehouse average.
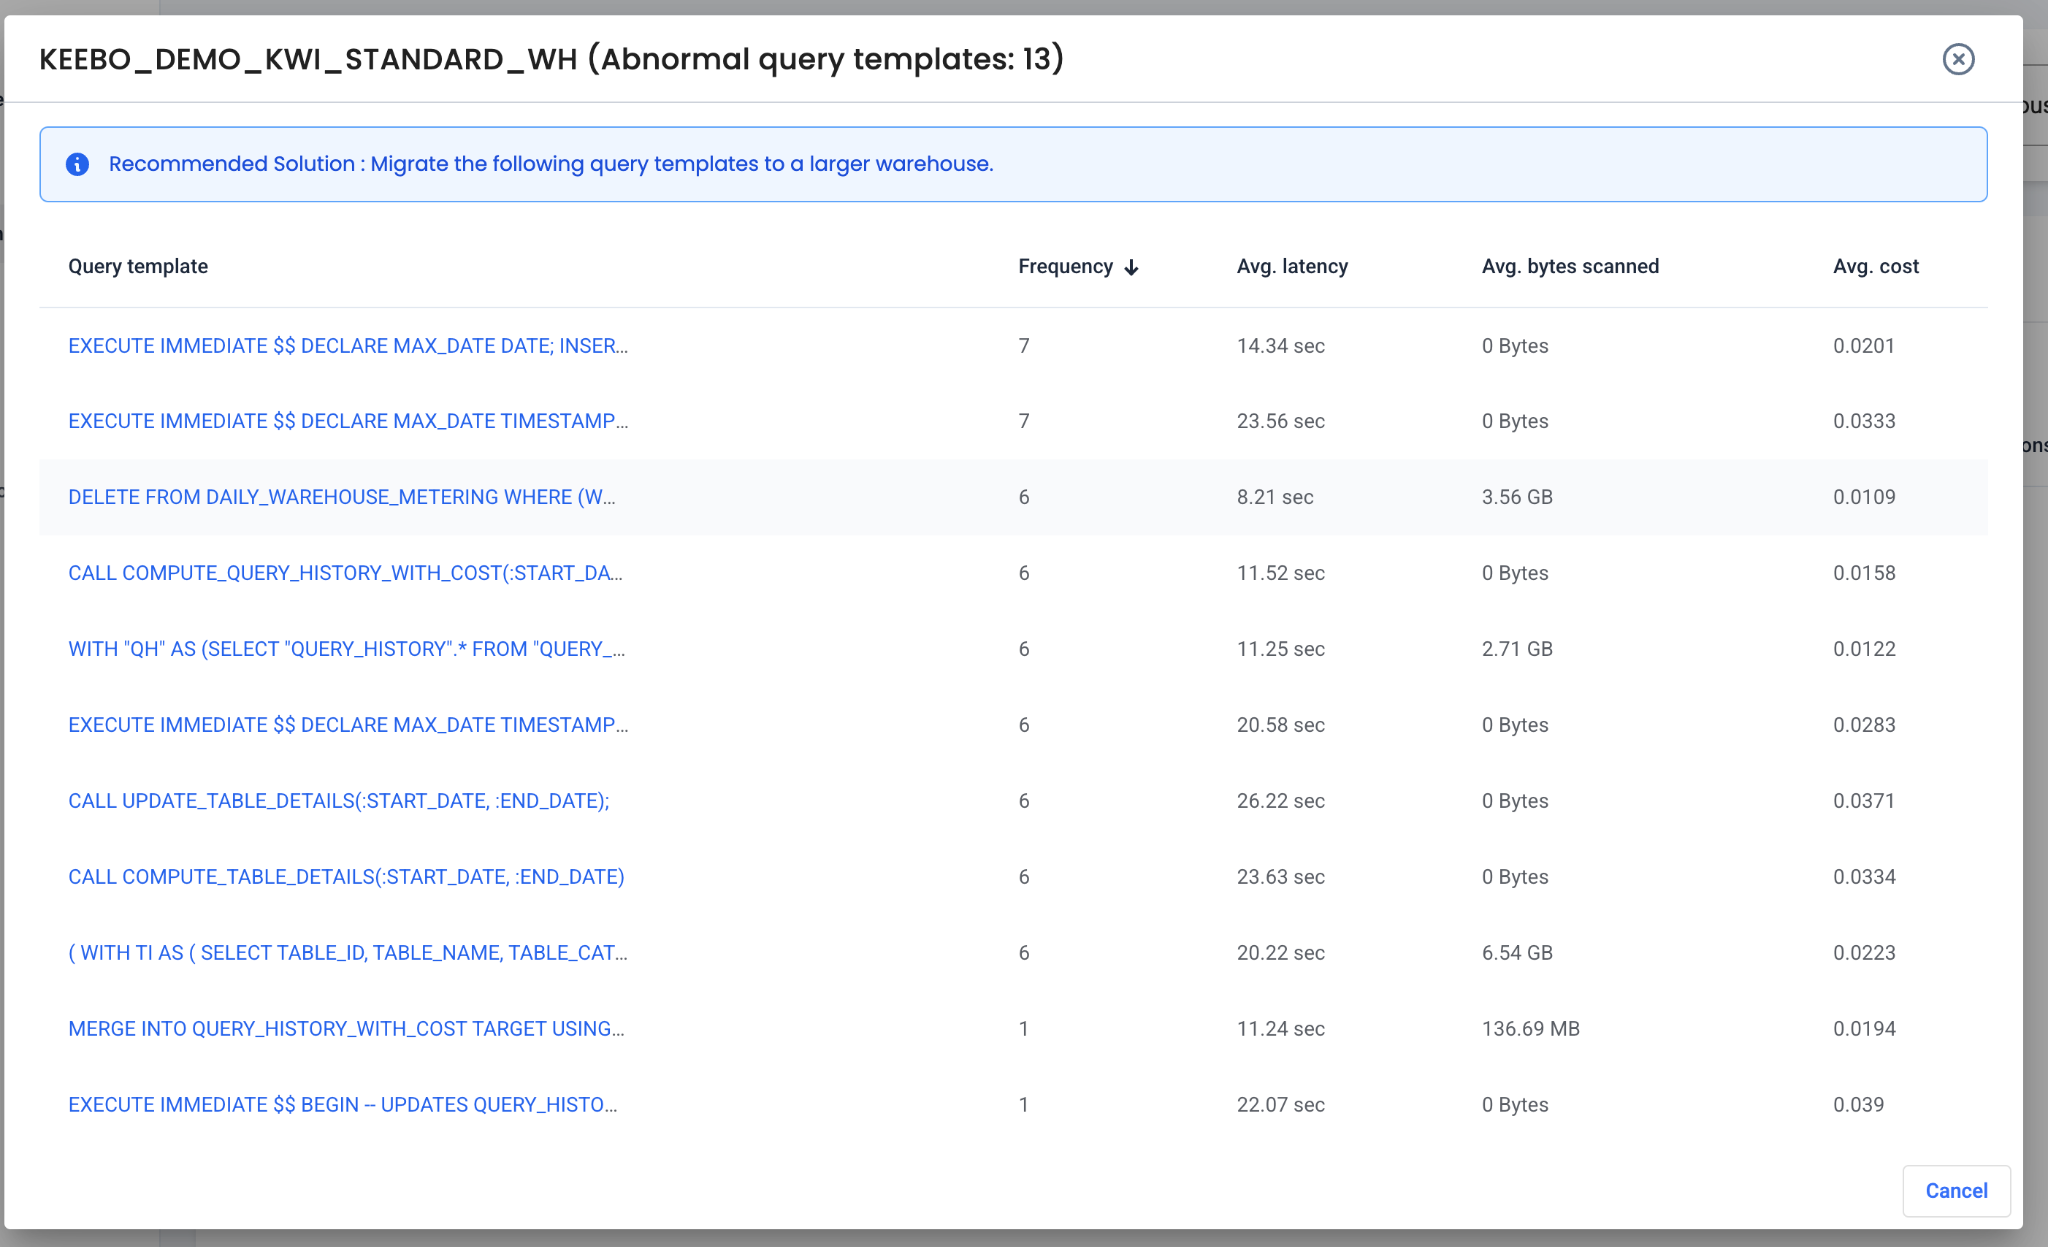
Impact
These queries can create performance bottlenecks and may cost more than necessary on the current warehouse.
Recommended Action
Migrate these queries to another warehouse. For some queries, moving to a warehouse of the same size removes bottlenecks. For others, moving to a larger warehouse improves performance or potentially reduces costs.