Spend Analytics
What Does Spend Analytics Show?
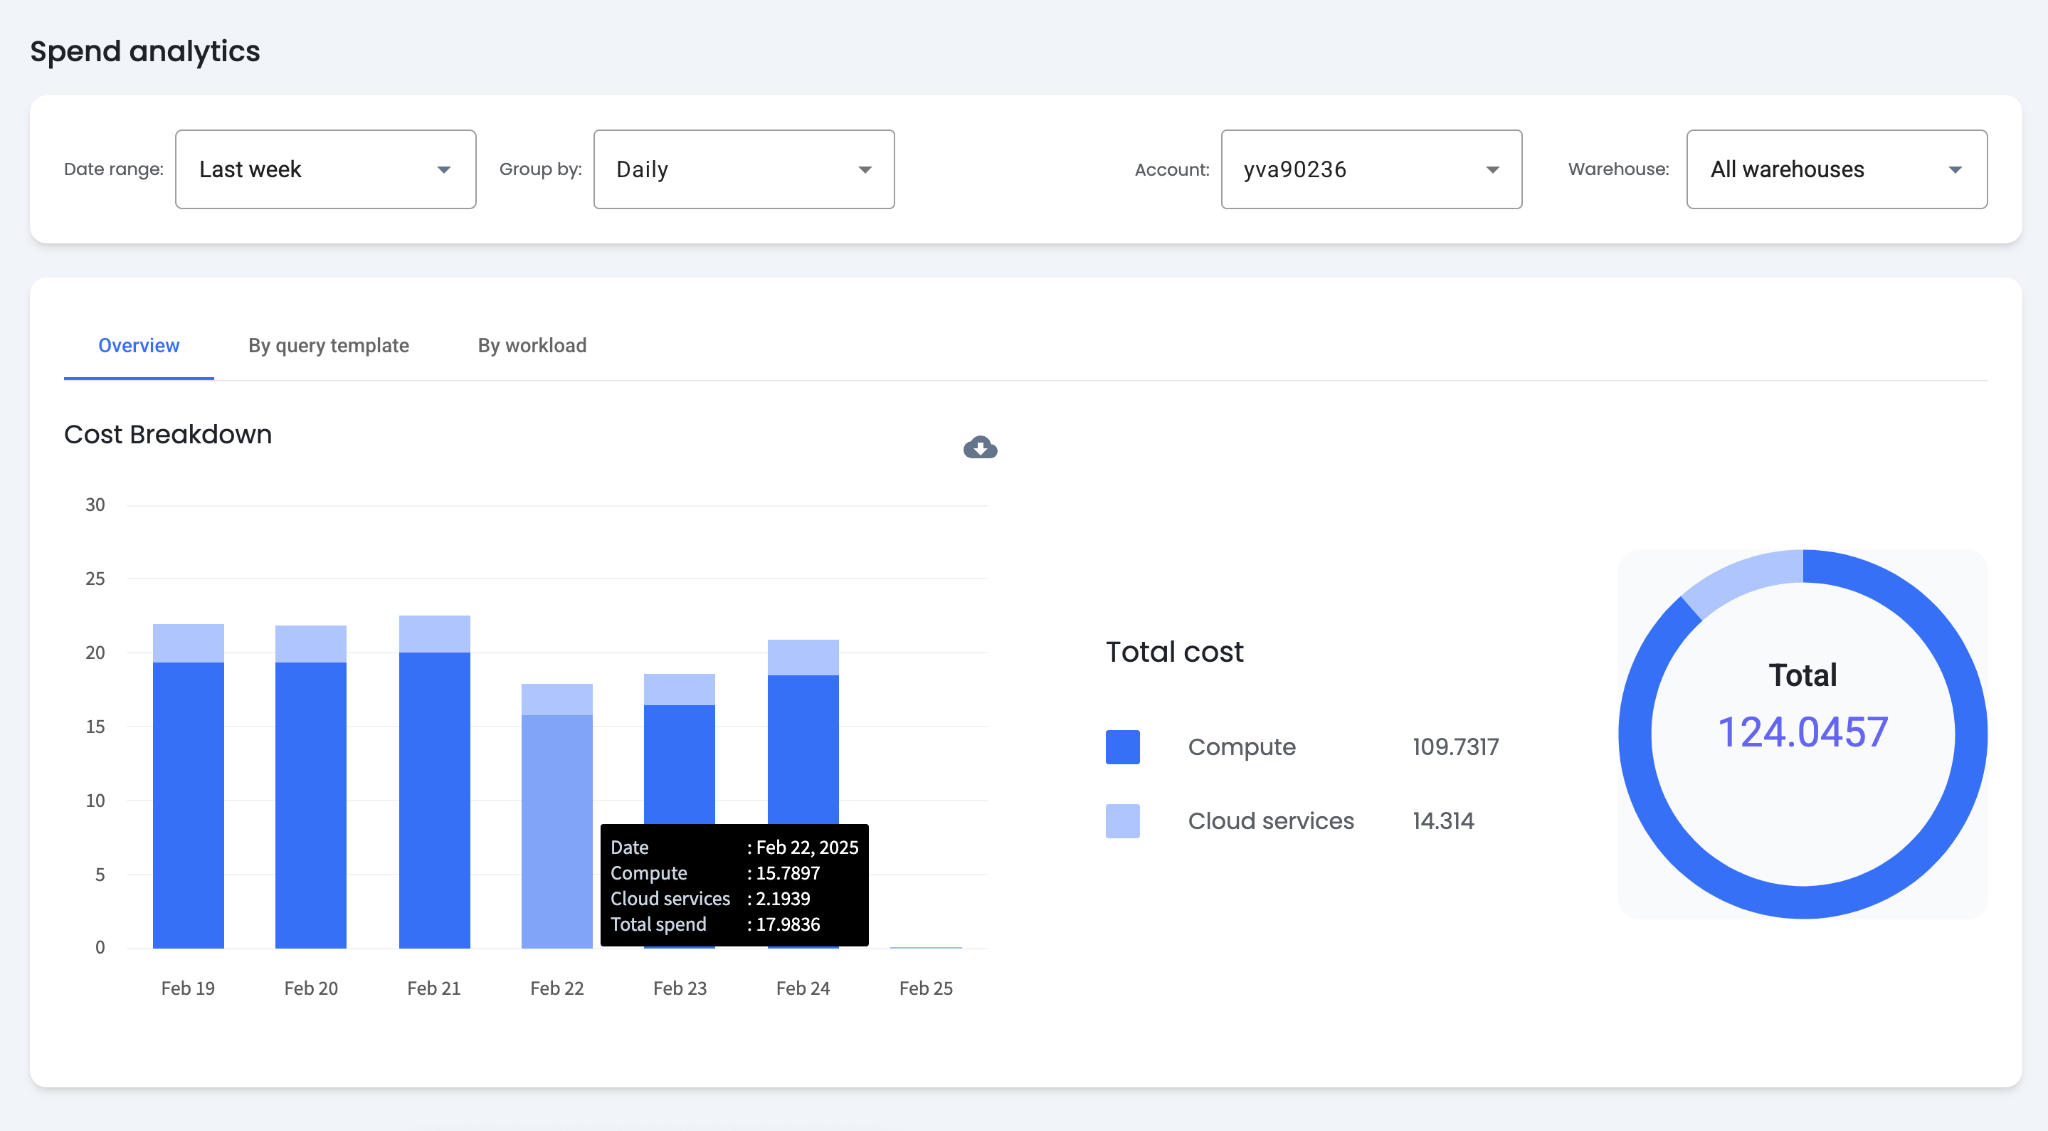
Spend Analytics provides an overview of Snowflake spending. Navigate to this page by clicking "Spend Analytics" under Workload Intelligence in the left-hand menu.
Filters
Filters at the top of the page control the data shown in the charts. By default, charts display the last week of data grouped daily for all warehouses. The date range, grouping (daily, weekly, or monthly), and warehouse selection can all be adjusted. This page displays data for one account at a time. Use the account filter to change the selected account.
Cost Breakdown
The cost breakdown charts display credit usage over the selected time range. Dark blue represents Snowflake credits used on compute. Light blue represents credits used on cloud services.
Compute
Snowflake compute is consumed when warehouses execute queries.
Cloud Services
Cloud services charges cover metadata management, authentication, query optimization, and access control. Snowflake does not bill for cloud services if they are less than 10% of total spend.
What Does the Query Templates Tab Show?
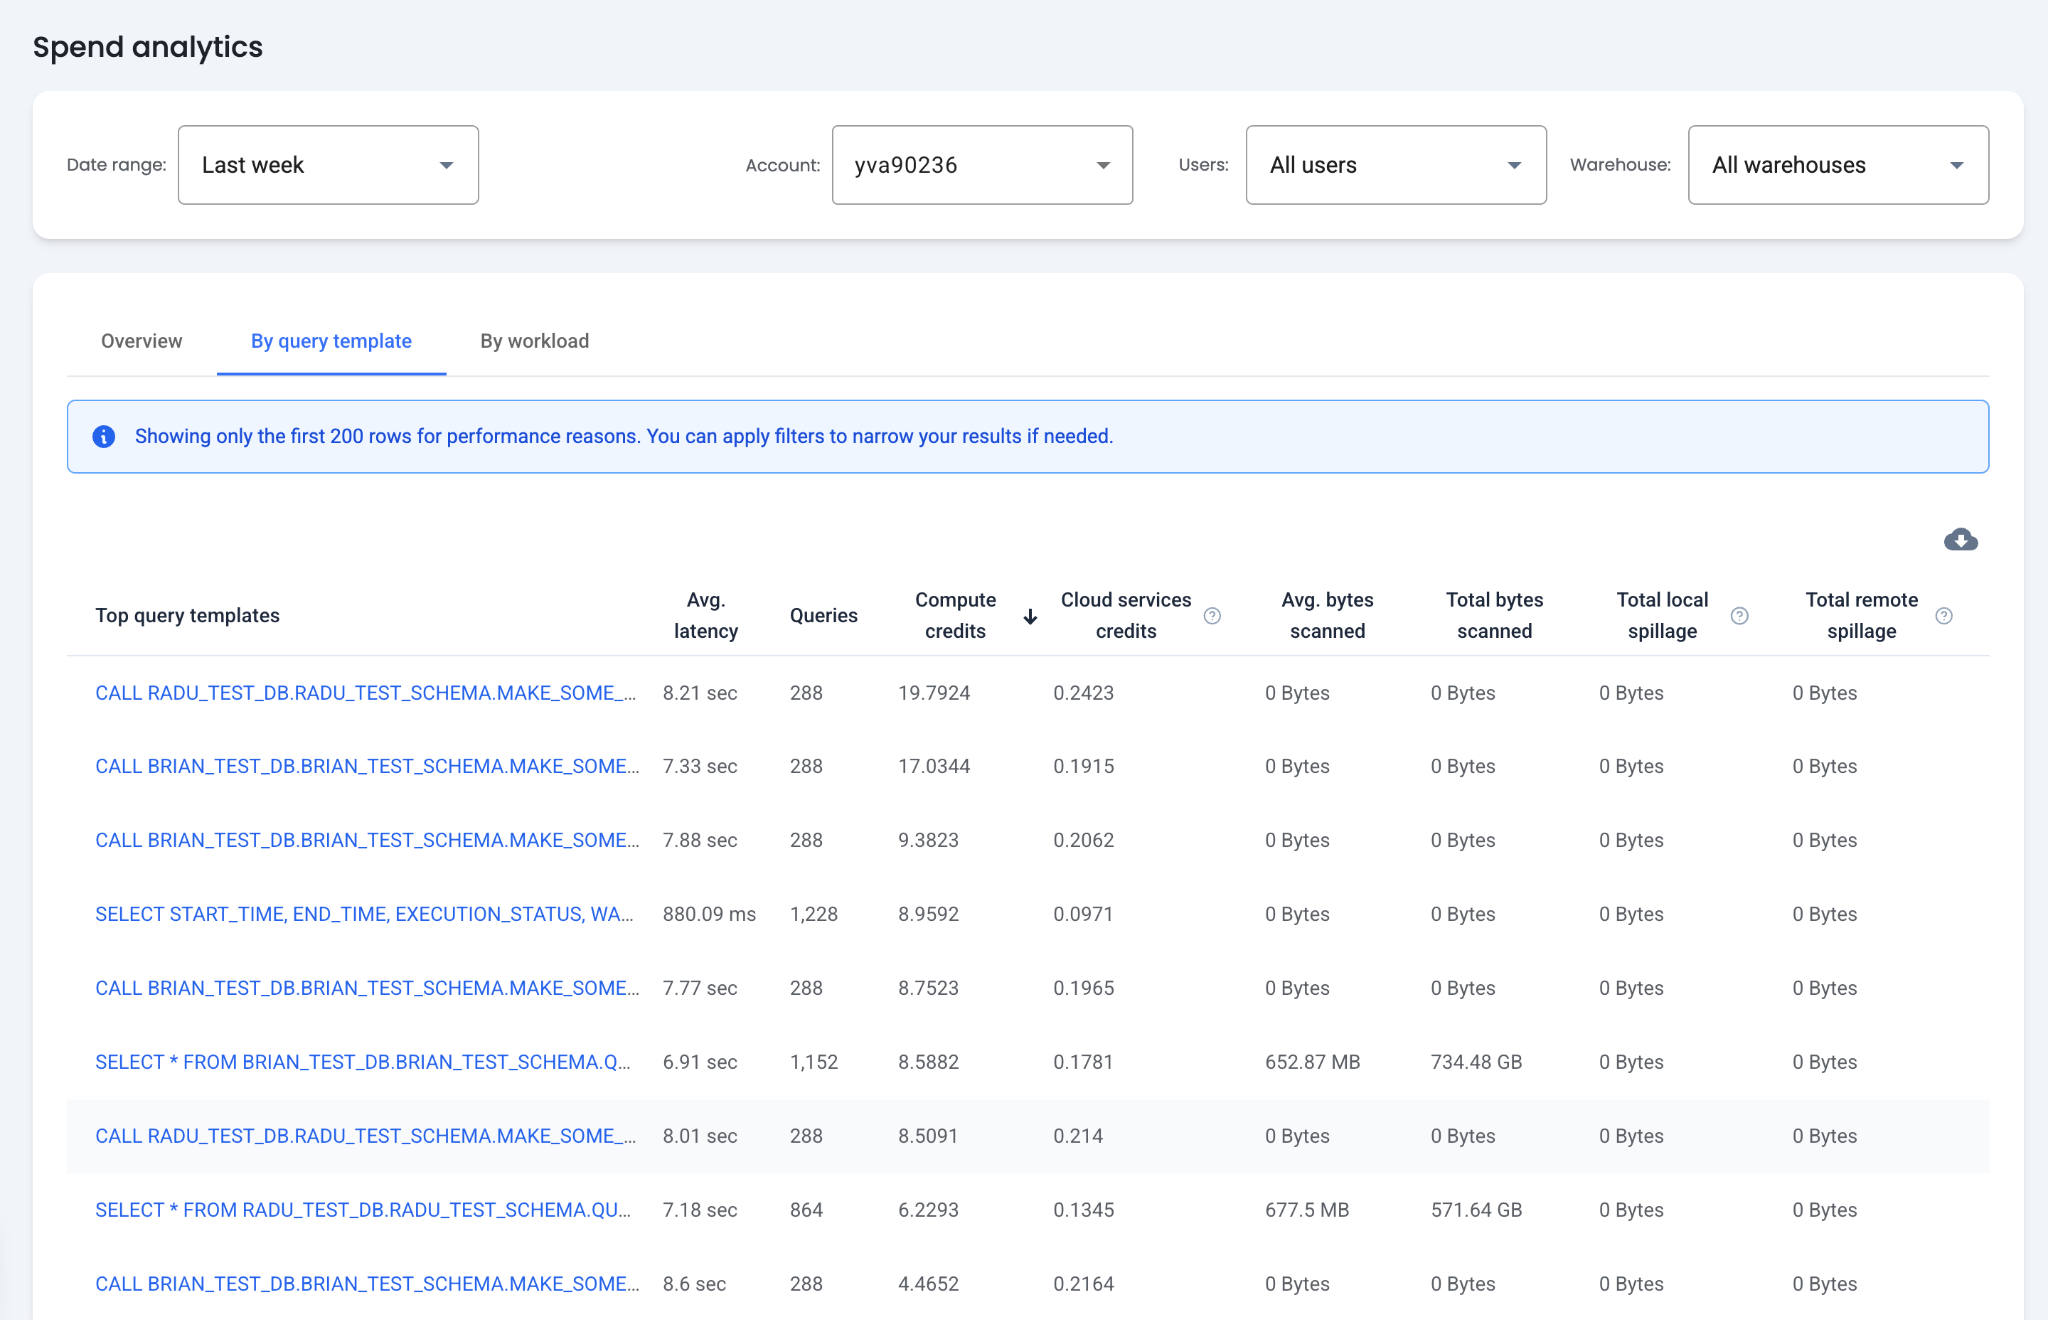
The "By Query Template" tab displays spending and performance statistics for query templates. Query templates are groups of queries with similar characteristics. This table supports analyzing the performance and cost of each template.
Top Query Templates
This column shows a preview of the query template. Clicking the preview opens a Details page with the following tabs:
- Details — Contains the full query template and relevant statistics for the template.
- Query Instances — Shows each query instance in the selected time range, including the query timestamp, execution time, user, and role.
- Users — Shows each user running the query, including query frequency, date range of runs, and the last run time.
- Warehouses — Shows which warehouses the query ran on, including query frequency, date range, and last run time.
Table Columns
- Average Latency — The average latency across all query instances. This includes all phases of query processing: compilation, queueing, and execution.
- Queries — The total number of runs for the query template over the specified date range.
- Total Credits — The total credits spent for the query template over the specified date range.
- Average and Total Bytes Scanned — The total and average bytes scanned by the query template. Bytes scanned refers to the total amount of data read from storage to execute a query.
- Total Local and Remote Spillage — The total volume of data spilled to local and remote disks. Spillage occurs when a query requires more memory than is available in the virtual warehouse. Spillage increases latency, with remote spillage causing a more severe impact than local spillage.
Note: The table can be sorted by each column. Only the first 200 rows for the sort appear in the table.
What Are Query Templates?
Query templates are groups of queries with similar structures. A query template is a recurring query structure that excludes variables and constants that may change frequently. Query templates are shared by multiple query instances.
For example, running the same query with different dates produces separate query instances, but they belong to the same template. This allows analysis of all related queries as a group.
How Are Optimization Opportunities Identified?
The "By Query Template" table provides information to help identify optimization opportunities.
Increase Savings
- Most Costly Templates — By default, Workload Intelligence sorts the table by the most expensive query templates first. Prioritizing these templates for optimization has the greatest impact on overall costs.
- Templates With the Most Spillage — Large amounts of local and remote spillage lead to higher execution times and costs. Reducing spillage for these queries lowers costs.
- Total Bytes Scanned — Sorting by total bytes scanned identifies queries that may benefit from optimization. Total bytes scanned correlates with cost, and reducing bytes scanned may save Snowflake credits.
Improve Performance
- Average Latency — Sorting by average latency surfaces the longest-running queries. These templates may benefit most from performance optimization.
- Average Bytes Scanned — Optimizing templates with the most bytes scanned can improve performance, as scanning large amounts of data correlates with long execution times.
What Does the Workload Tab Show?
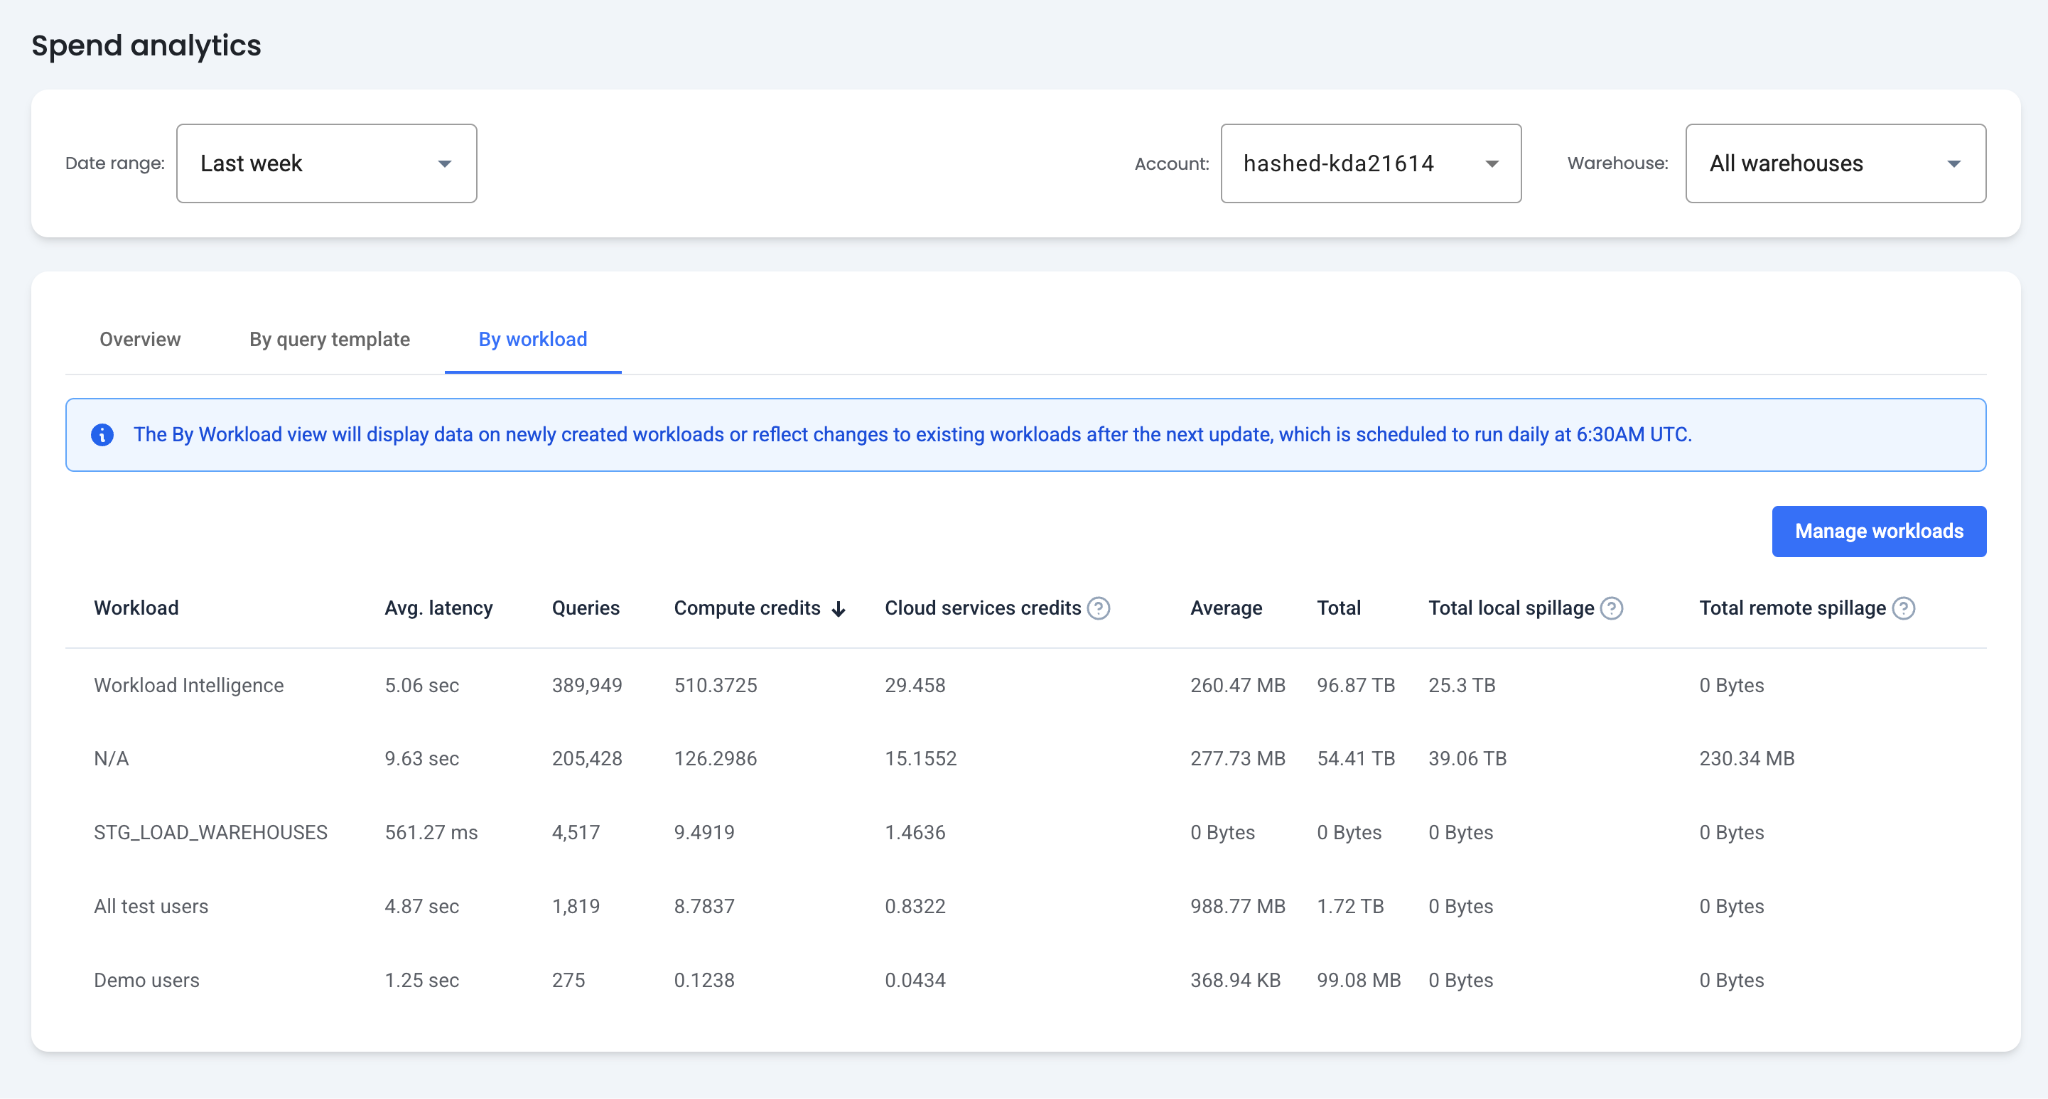
The "By Workload" tab displays the same information as the "By Query Template" tab for custom-defined workloads. Workloads are user-defined groups of queries for a Snowflake account. They enable attributing spend to any desired grouping of queries.
What Are Workloads?
Workloads are groups of queries defined by specific criteria such as warehouses or users. They enable analysis of which groupings contribute the most to cost or performance issues. Workloads are defined at the Snowflake account level and can contain any number of queries within a single account but cannot span multiple accounts.
Workload Criteria
- Query Tags — Include only queries with specific query tags.
- Warehouses — Include only queries from a set of warehouses.
- Users — Include only queries run by a set of users.
- Roles — Include only queries run with specific roles.
How Are Workloads Managed?
Click "Manage Workloads" to view all workloads defined for the Snowflake account. From this page, workloads can be added, edited, and deleted.
- Add Workload — Click "Add Workload" to define a new workload. Provide a name and select a criteria type: query tags, warehouses, users, or roles. Add all desired instances of the criteria and click "Save Metric." Data for the new workload can take up to 24 hours to appear in the "By Workload" table.
- Edit Workload — Click the edit icon next to a workload to modify its criteria.
- Delete Workload — Click the delete icon next to a workload to remove it.
What Are Example Workloads?
The following examples illustrate workloads for each criterion:
- Query Tags for Looker Dashboards — Looker can be configured to add a query tag to every query it sends to Snowflake. A workload using this tag attributes Snowflake usage to Looker dashboards.
- Warehouses — Organizations that set up warehouses per customer can create workloads grouped by warehouse to attribute Snowflake usage to each customer.
- Users — Teams running queries directly on Snowflake can be grouped into workloads to compare Snowflake usage between teams.
- Roles — Applications that use a Snowflake role to operate on an account can be grouped into workloads to attribute and compare usage.
How Are Workload Cost and Performance Analyzed?
Manage Spending
- Compare Usage — Workloads enable comparing Snowflake usage between users, teams, customers, and other groupings to identify which are consuming the most credits.
- Attribute and Budget Usage — Workloads attribute Snowflake usage to stakeholders. Analyze workload usage totals to verify stakeholders remain within budget.
- Manage Spillage — Workloads reveal whether specific use cases contribute to large amounts of local and remote spillage, which may indicate cost savings opportunities.
Improve Performance
- Compare Performance — Workloads enable comparing average latency between different Snowflake stakeholders to identify groups experiencing significantly longer latency.