Query Health
What Does the Query Health Overview Show?
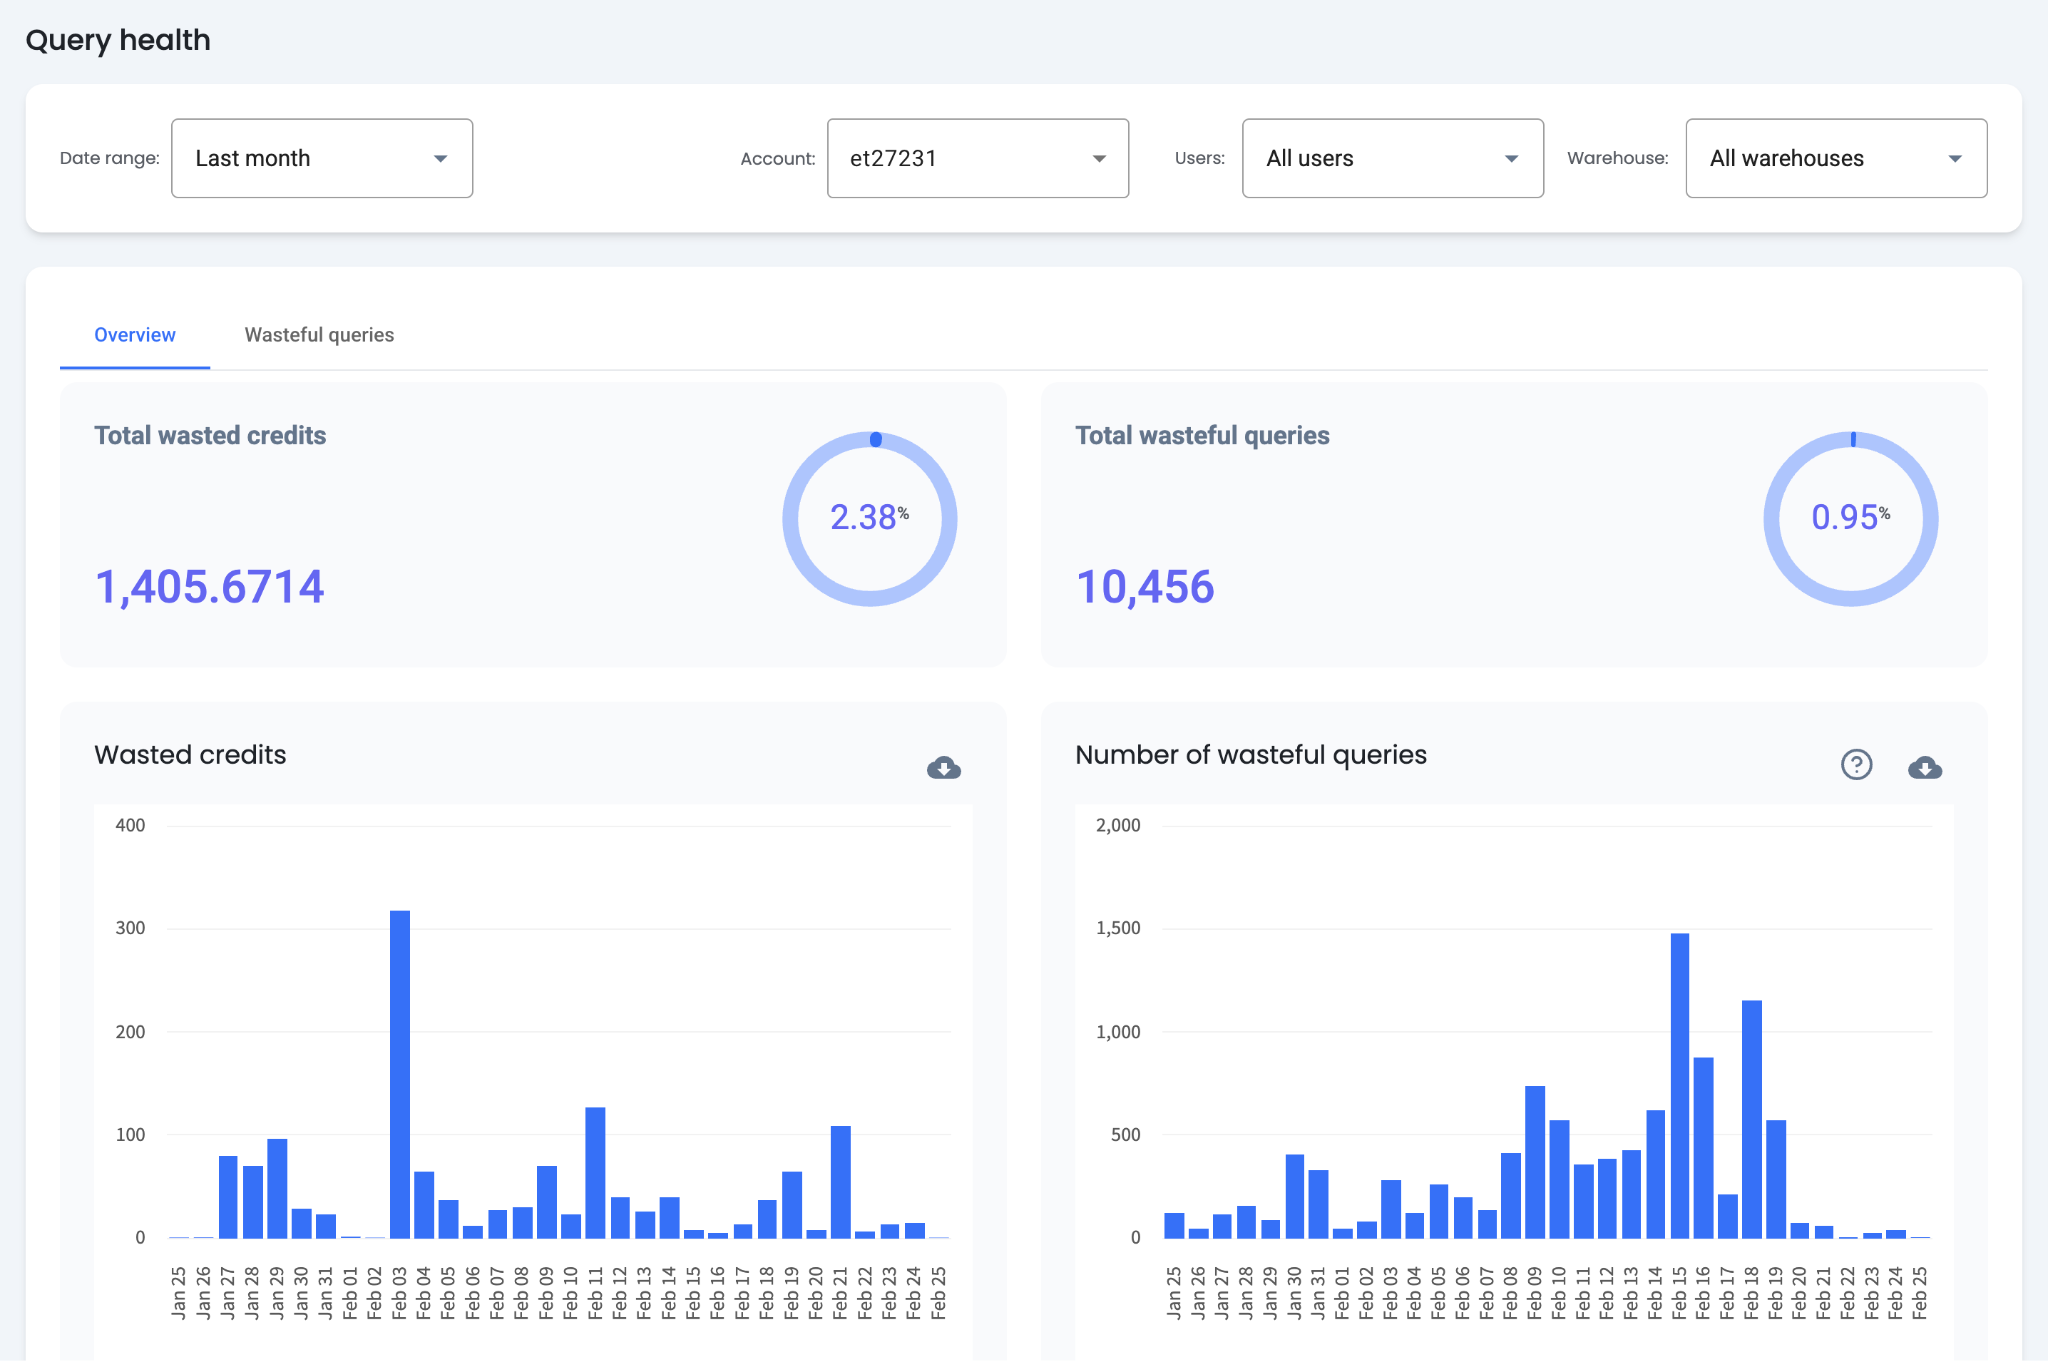
The Query Health overview charts provide insight into credits wasted by failed queries. Charts can be filtered by any combination of time range, warehouses, and users. Each chart displays data for a single account at a time.
Overview Metrics
- Total Wasted Credits — The total credits wasted by failed queries for the selected period, along with the percentage of wasted credits relative to total spent credits.
- Total Wasteful Queries — The total number of wasteful queries for the selected period, along with the percentage of wasteful queries relative to all queries.
- Wasted Credits Chart — A bar graph visualizing total wasted credits over time based on the selected criteria, showing trends and patterns in credit waste.
- Number of Wasteful Queries Chart — A bar graph displaying the total number of wasteful queries over time based on the selected criteria, showing trends and patterns in query waste.
How Are Wasteful Queries Found and Analyzed?
The "Wasteful Queries" tab contains a table showing query templates ordered by failure rate. This table identifies queries that need optimization. Templates are ordered by failure rate by default but can be sorted by any column.
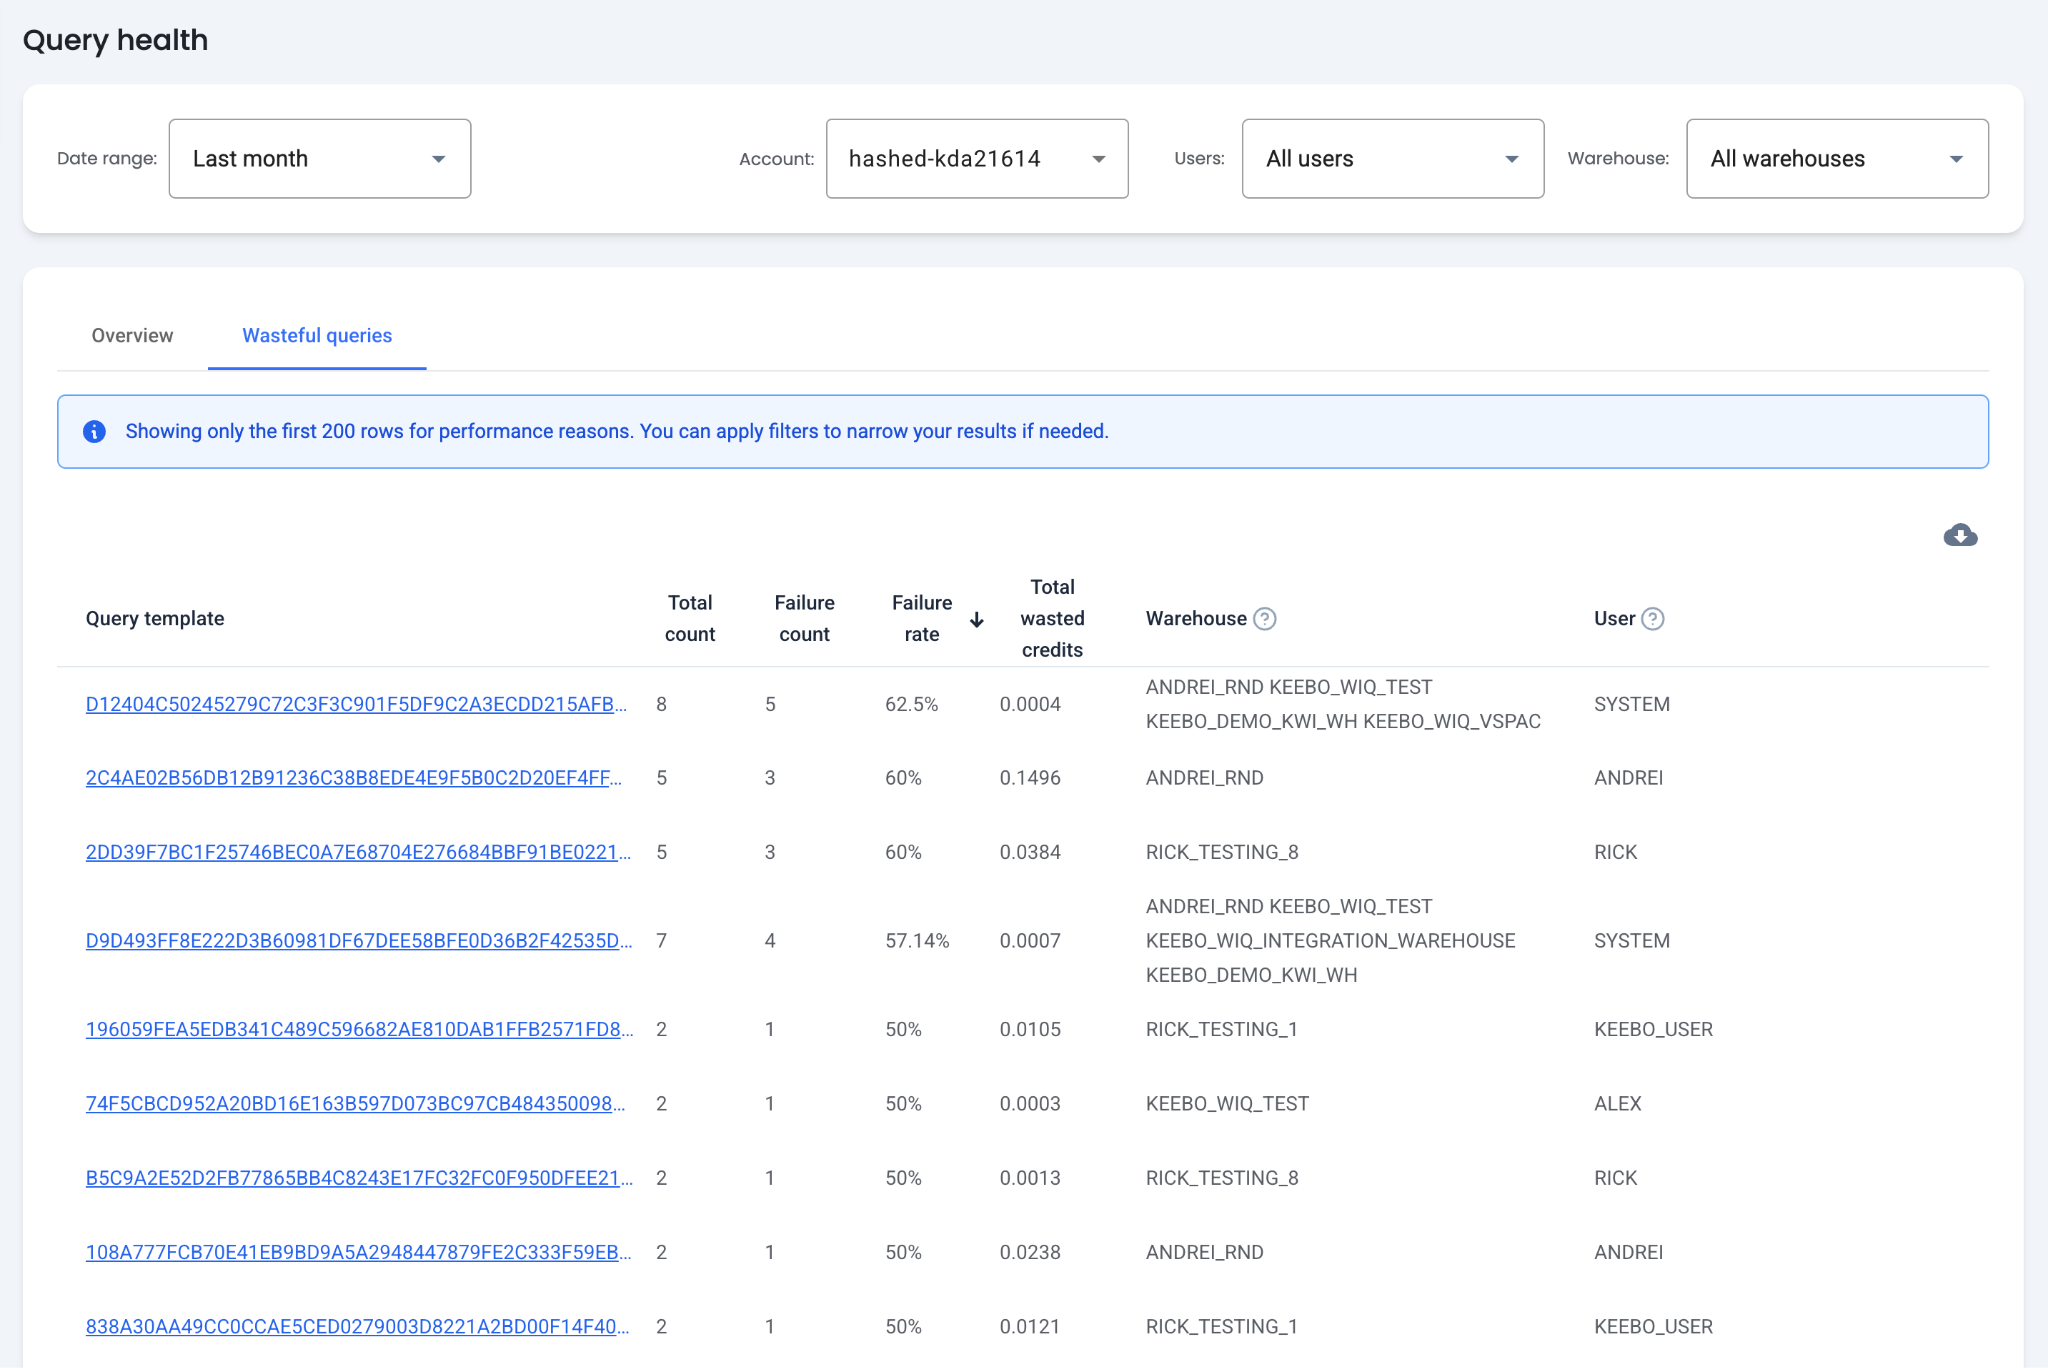
Table Columns
- Total Count — The total times a query template has run.
- Failure Count — The total number of failures for a query template.
- Failure Rate — The percentage of times a particular query template fails.
- Total Wasted Credits — All Snowflake credits spent by wasteful queries.
- Warehouse — The most common warehouse that has run the query template.
- User — The most common user that has run the query template.
Query Template Details
The query template column shows the beginning of the query template or the query hash. Clicking the template or hash opens a query details modal with the following tabs:
- Query Details — An overview of queries associated with the template, including the full template text, average latency, total credits, total wasted credits, and failure rate.
- Query Instances — A table of each query instance, including the query text, timestamp, execution time, user, and role.
- Users — The users that have run the query template.
- Warehouses — The warehouses where the query template has run.
How Can Costs Be Decreased and Performance Improved?
Sort queries by total wasted credits to prioritize the most costly failures first.
Filter Out Ad-Hoc Queries
Queries with the highest failure rates are commonly ad-hoc queries that failed due to syntax errors. To filter these out, select a warehouse or user that does not run ad-hoc queries.
Identify Resource Constraints
Some queries fail due to resource constraints. To resolve these issues, consider running them on a larger warehouse or one with less activity.