Keebo Warehouse Optimization Optimizations Page for Databricks
Warehouse Optimization for Databricks is currently in preview. Reach out to Keebo support for access and onboarding.
The Optimizations page is a read-only audit trail of the rightsizing and idle-time decisions Warehouse Optimization makes on a SQL warehouse, shown alongside the warehouse's performance metrics for the same period. It provides visibility into what Warehouse Optimization changed, why, and how the warehouse behaved during that time.
The page displays optimization decisions and query performance metrics for one warehouse at a time. Filters customize the view by date range, account, workspace, and warehouse.
What Metrics Are Available at the Warehouse Level?

Idle-Time Optimizations
This metric shows the total number of idle-time tuning decisions over the selected time range.
Rightsizing Optimizations
This metric shows the total number of rightsizing decisions over the selected time range.
Real-Time Backoffs
This metric shows the total number of backoff events triggered by a Performance Guardrail condition. A backoff reverts a warehouse to its baseline size regardless of what the rightsizing algorithm would otherwise decide. Backoff criteria are configured through performance guardrails on the Settings page.
Optimization Paused Time
This metric shows the amount of time optimizations were disabled for the warehouse during the selected date range.
How To Review Optimization Actions?
How Do Rightsizing Optimizations Work?
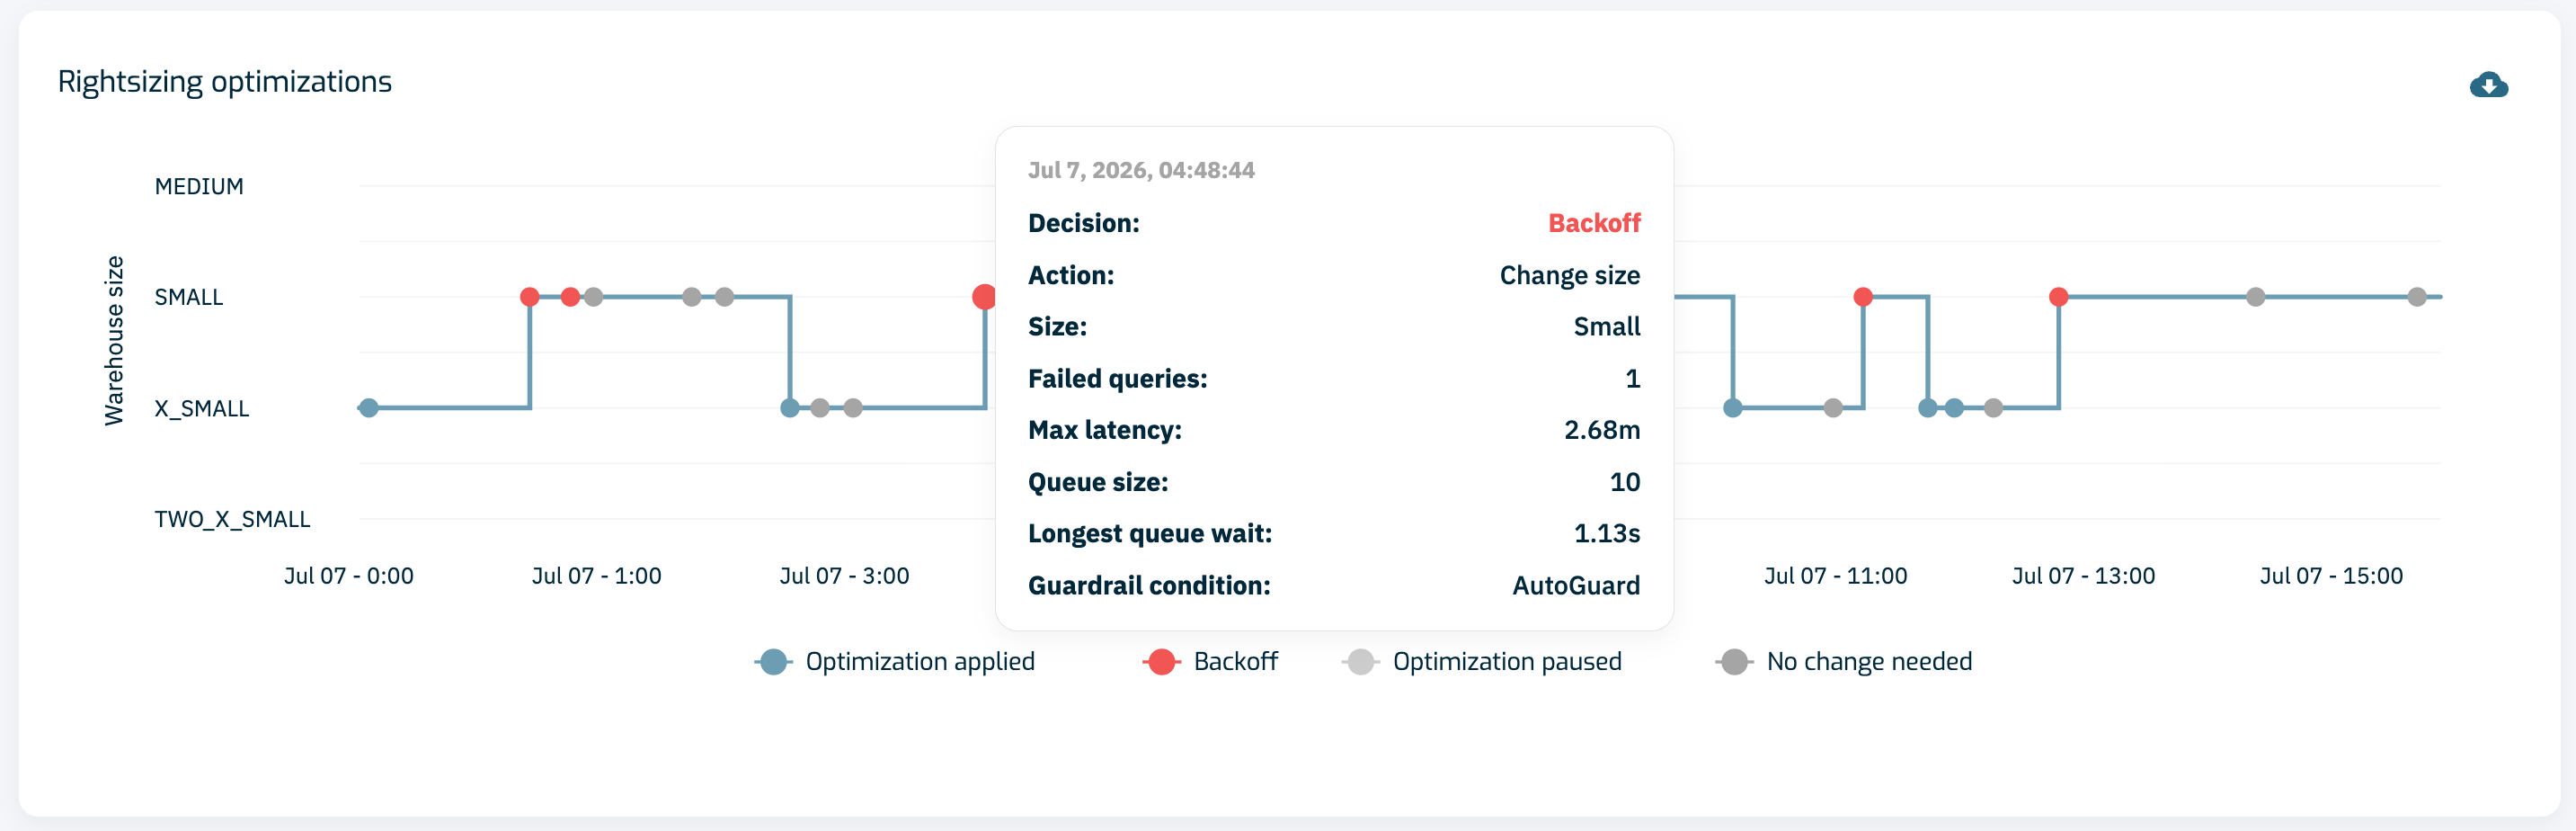
The "Rightsizing optimizations" chart is a step-line chart plotting warehouse size tier over time. Each marker represents a decision:
- Blue — a rightsizing decision was applied
- Red — a backoff reverted the warehouse to its baseline size
- Light gray — optimizations were paused for the warehouse
- Gray — no change was needed
Hovering a marker shows a tooltip with the timestamp, action type, warehouse size, failed query count, max latency, queue size, longest queue wait, and the guardrail condition that triggered the decision.
Backoff Behavior
Performance guardrails on the Settings page govern rightsizing backoffs. A backoff triggers when a configured guardrail condition — query latency, queue wait time, or queue depth — is met, or when AutoGuard detects a query timeout. The warehouse is reverted to its baseline size regardless of what the rightsizing algorithm would otherwise decide.
How Do Idle-Time Optimizations Work?
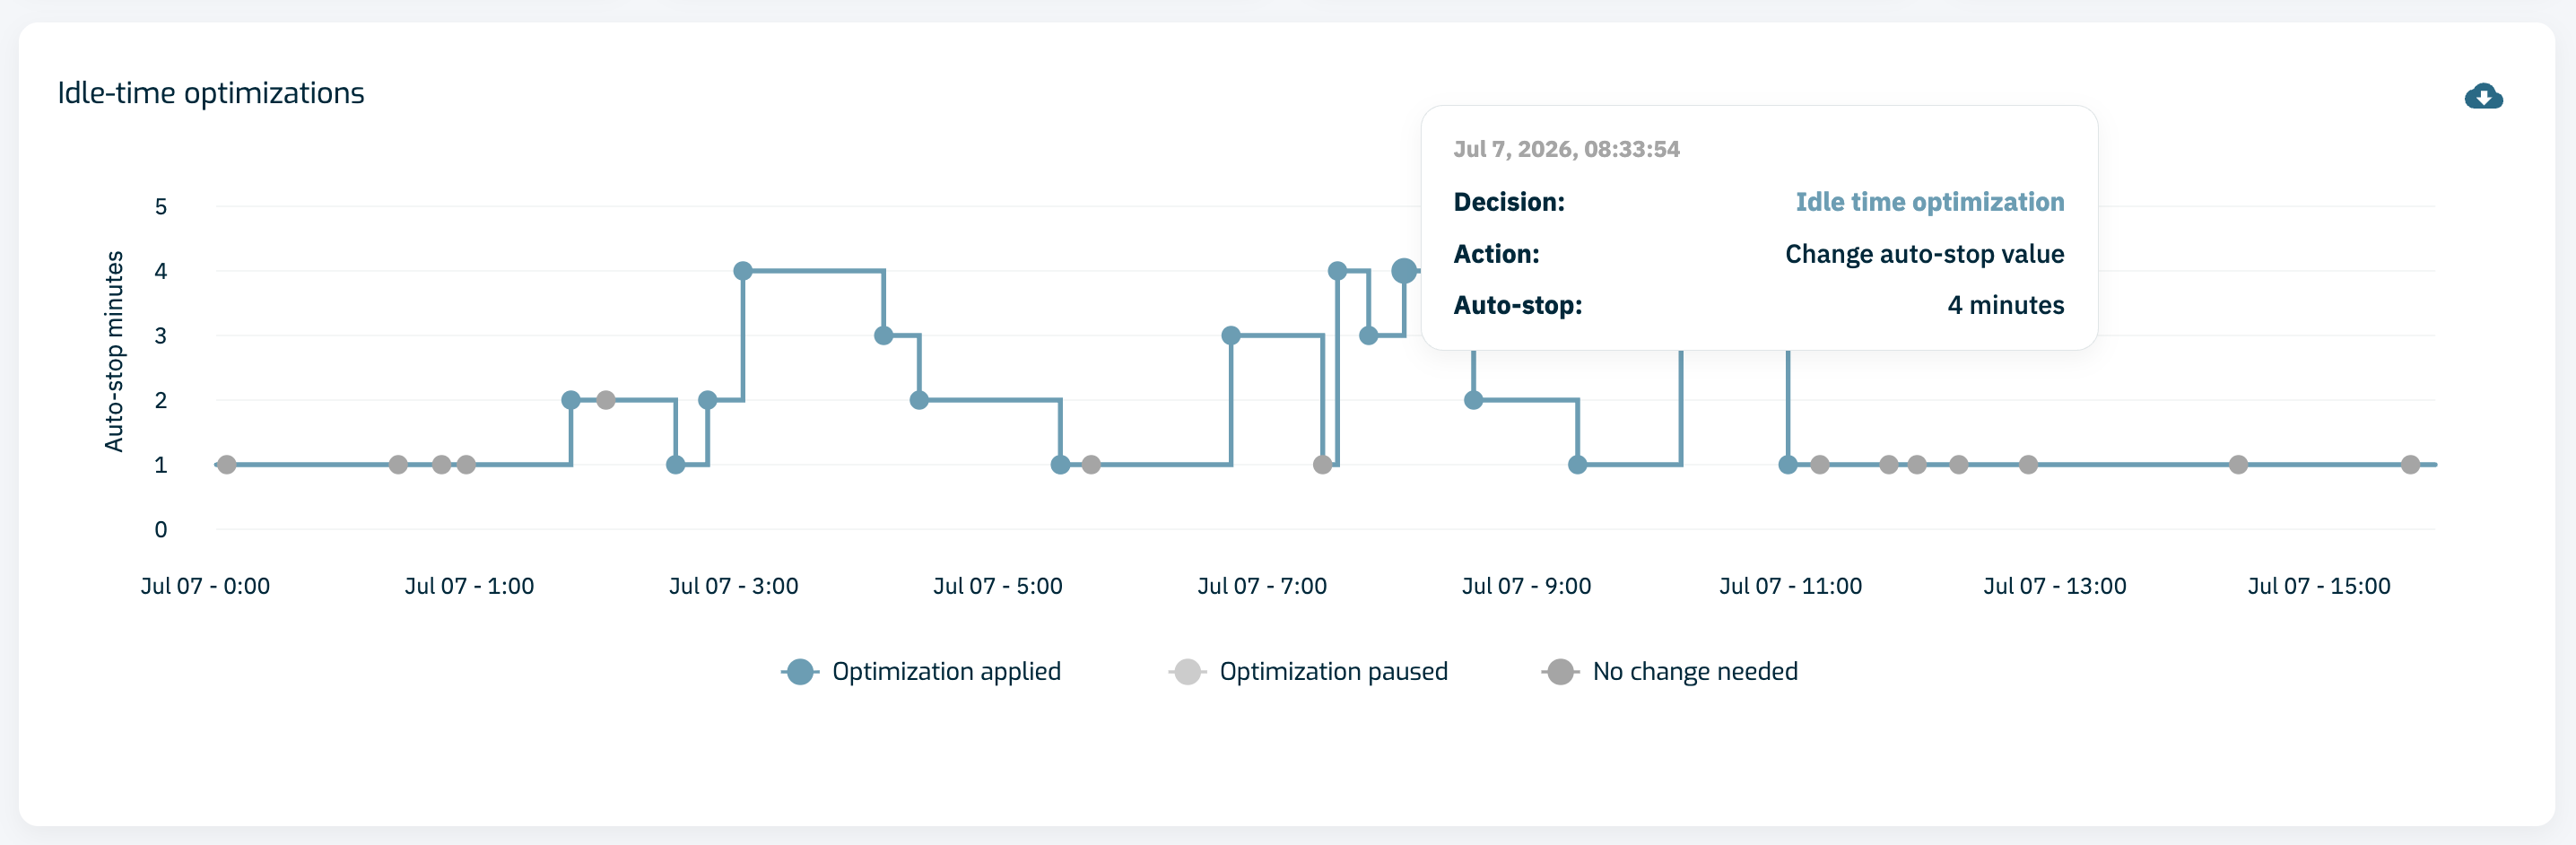
The "Idle-time optimizations" chart is a step-line chart plotting the warehouse's auto-stop value, in minutes, over time. Each marker represents a decision:
- Blue — an idle-time optimization was applied
- Light gray — optimizations were paused for the warehouse
- Gray — no change was needed
Hovering a marker shows a tooltip with the timestamp, action type, and auto-stop value. Idle-time optimizations do not trigger backoffs, so no red markers appear on this chart.
How Are Optimization Trends Analyzed?
The Optimizations page includes four warehouse statistics charts at hourly granularity, providing performance context alongside the optimization charts. These charts do not include optimization event overlays.
Query Count
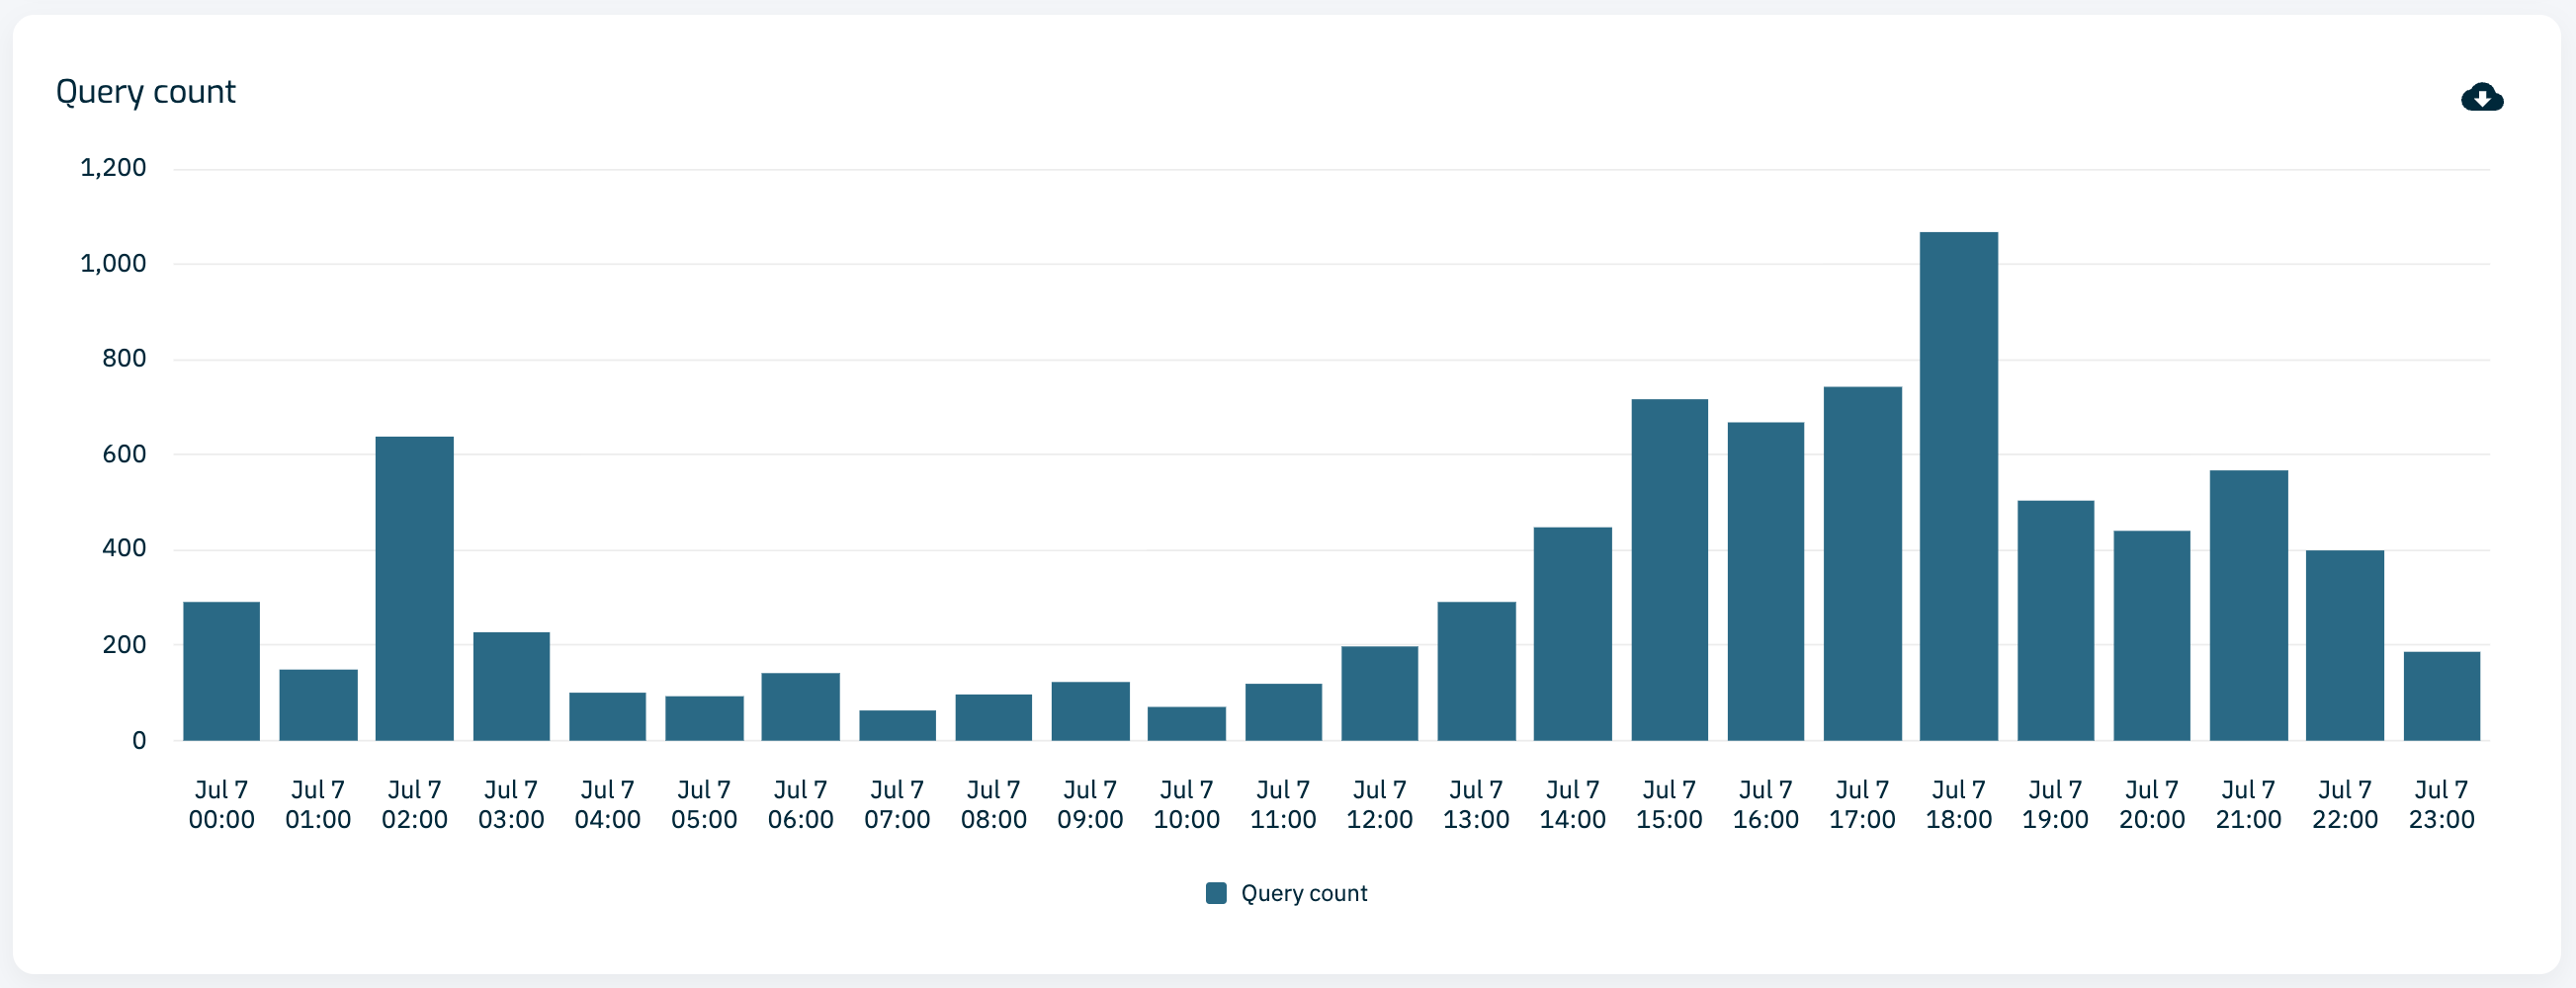
The "Query count" chart shows query volume over time for the warehouse. Query count provides a general indicator of warehouse activity, though queries vary widely in size.
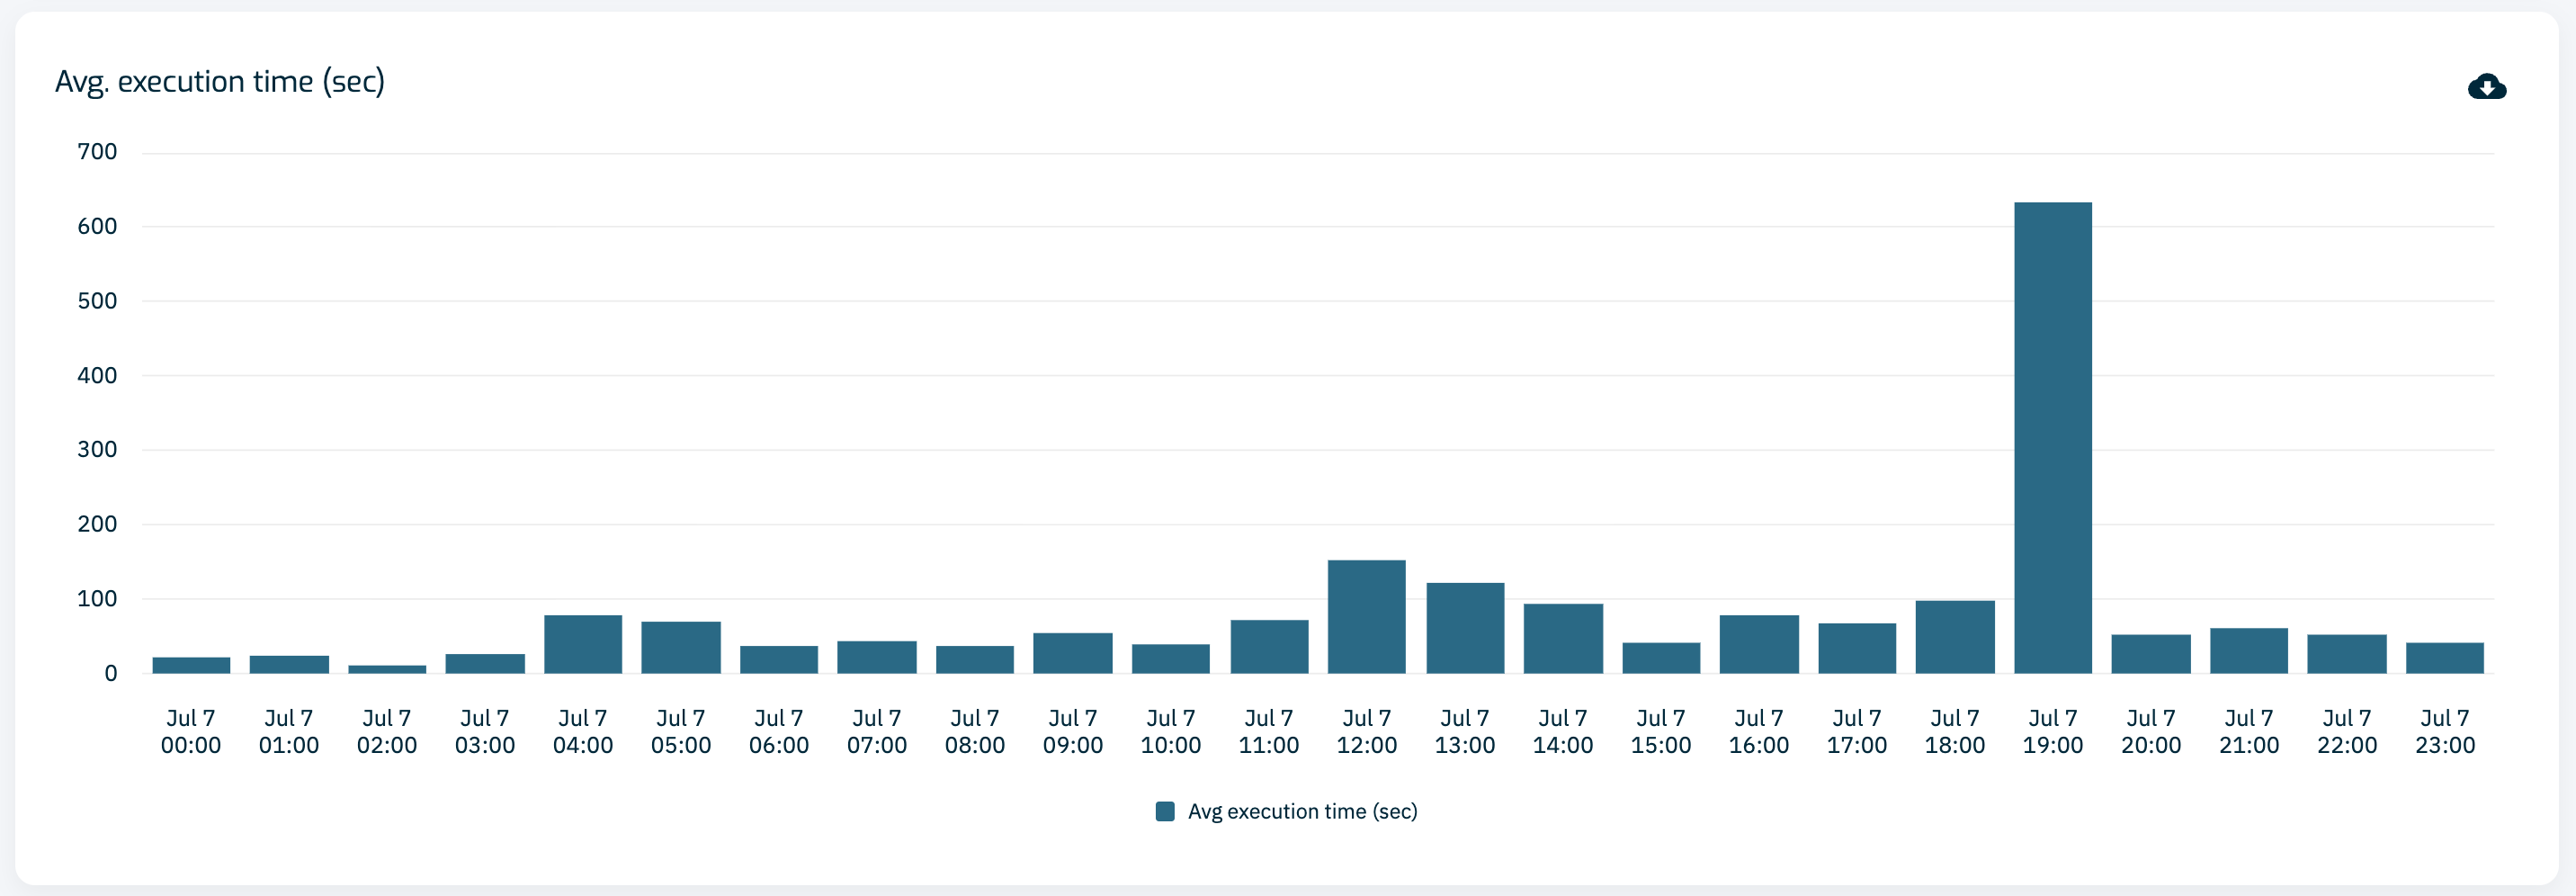
Average Execution Time
This chart shows average query execution time. High execution times may indicate low performance and directly increase per-query cost.
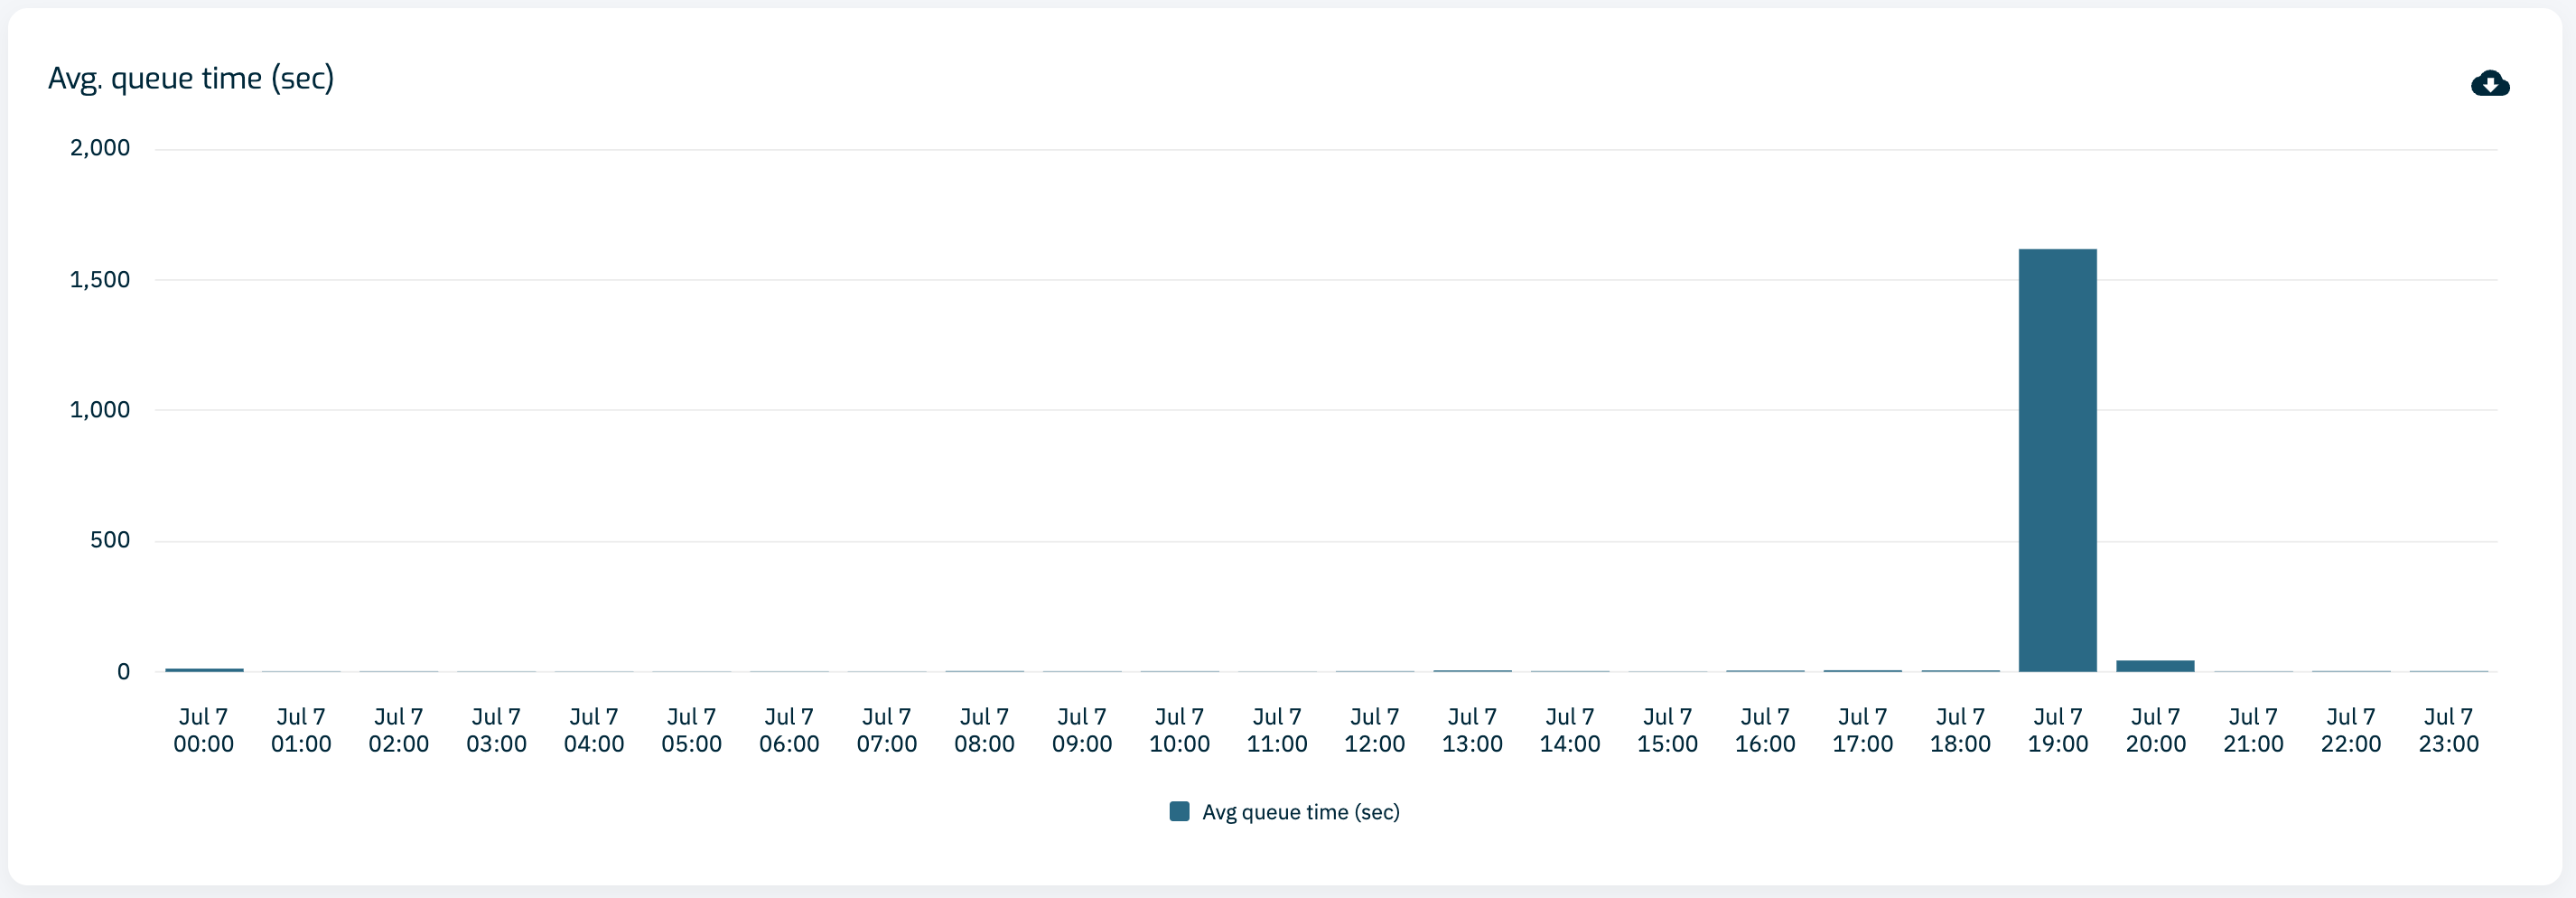
Average Queue Time
This chart shows average query queue time. High queue times indicate that queries are waiting longer to execute. Queue time can be used as a guardrail condition to define a maximum acceptable queue duration.
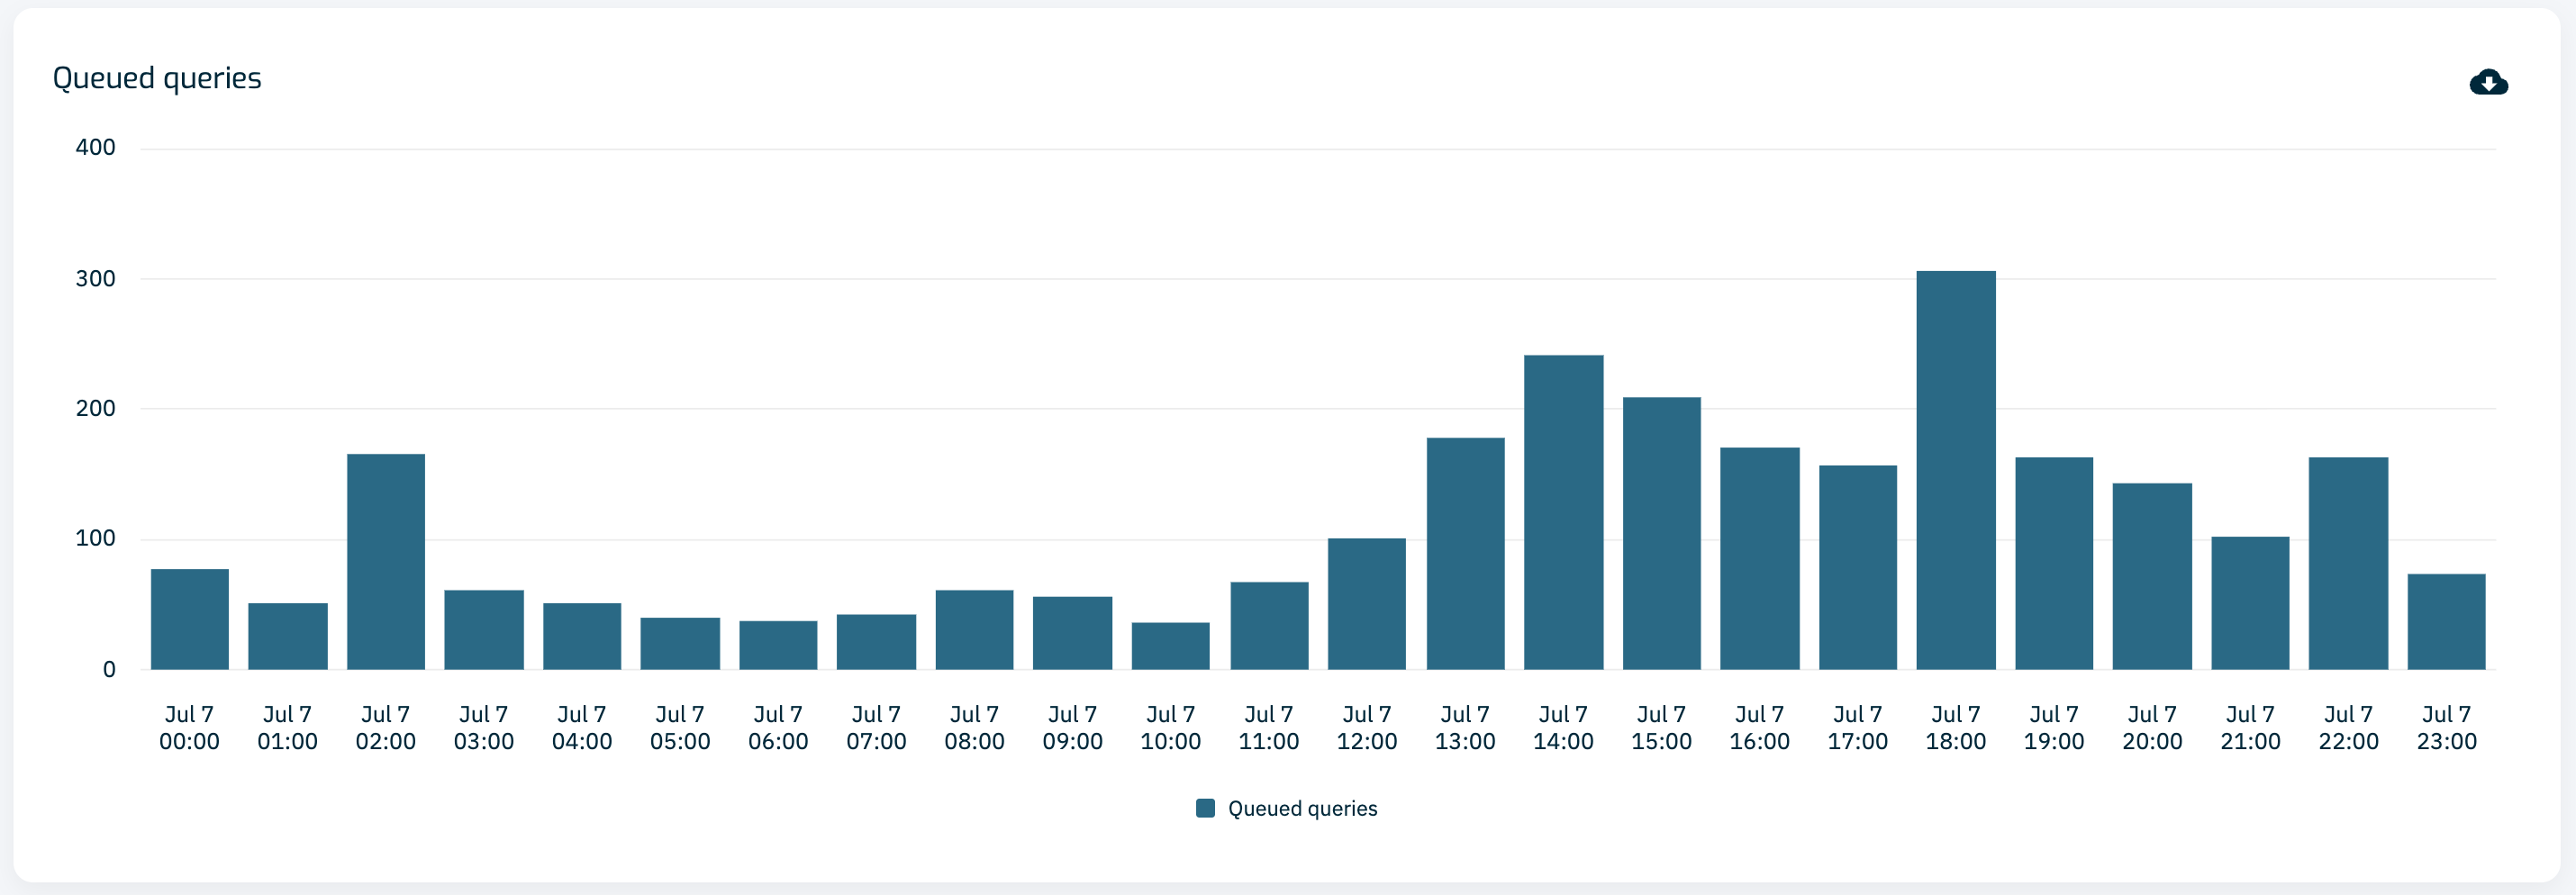
Queued Queries
This chart shows the total number of queued queries at any given time. High counts indicate that the warehouse is handling a larger query workload at that time. Queue depth can be used as a guardrail condition to define a maximum acceptable queue size.
When Should Warehouse Default Settings Be Updated?
Continuous Backoffs
If Warehouse Optimization frequently backs off on a warehouse, the guardrail condition is being met regularly. Consider decreasing the warehouse's baseline size by one tier.
Continuous Downsizes
If Warehouse Optimization almost always downsizes a warehouse, the baseline size may be larger than necessary. Consider decreasing the baseline size by one tier.
When Should Optimization Settings Be Updated?
Increase Savings
If performance indicators are consistently within acceptable levels, moving the Cost Savings slider toward "Low Cost" or "Lowest Cost" produces greater savings.
Increase Performance
If performance indicators are frequently elevated, moving the Cost Savings slider toward "Best Performance" or "Good Performance" improves warehouse performance.
How Are Charts Exported?
Each chart includes a download icon to export its underlying data as a CSV file.
What Happens When No Data Is Available?
When no optimization data exists for the selected filters, the chart areas display a placeholder message instead of empty axes.